Untangle Portfolio Risk.
You can see every position and still not know the risk.
"I have tried a lot of options trading software... Yours is perfect."
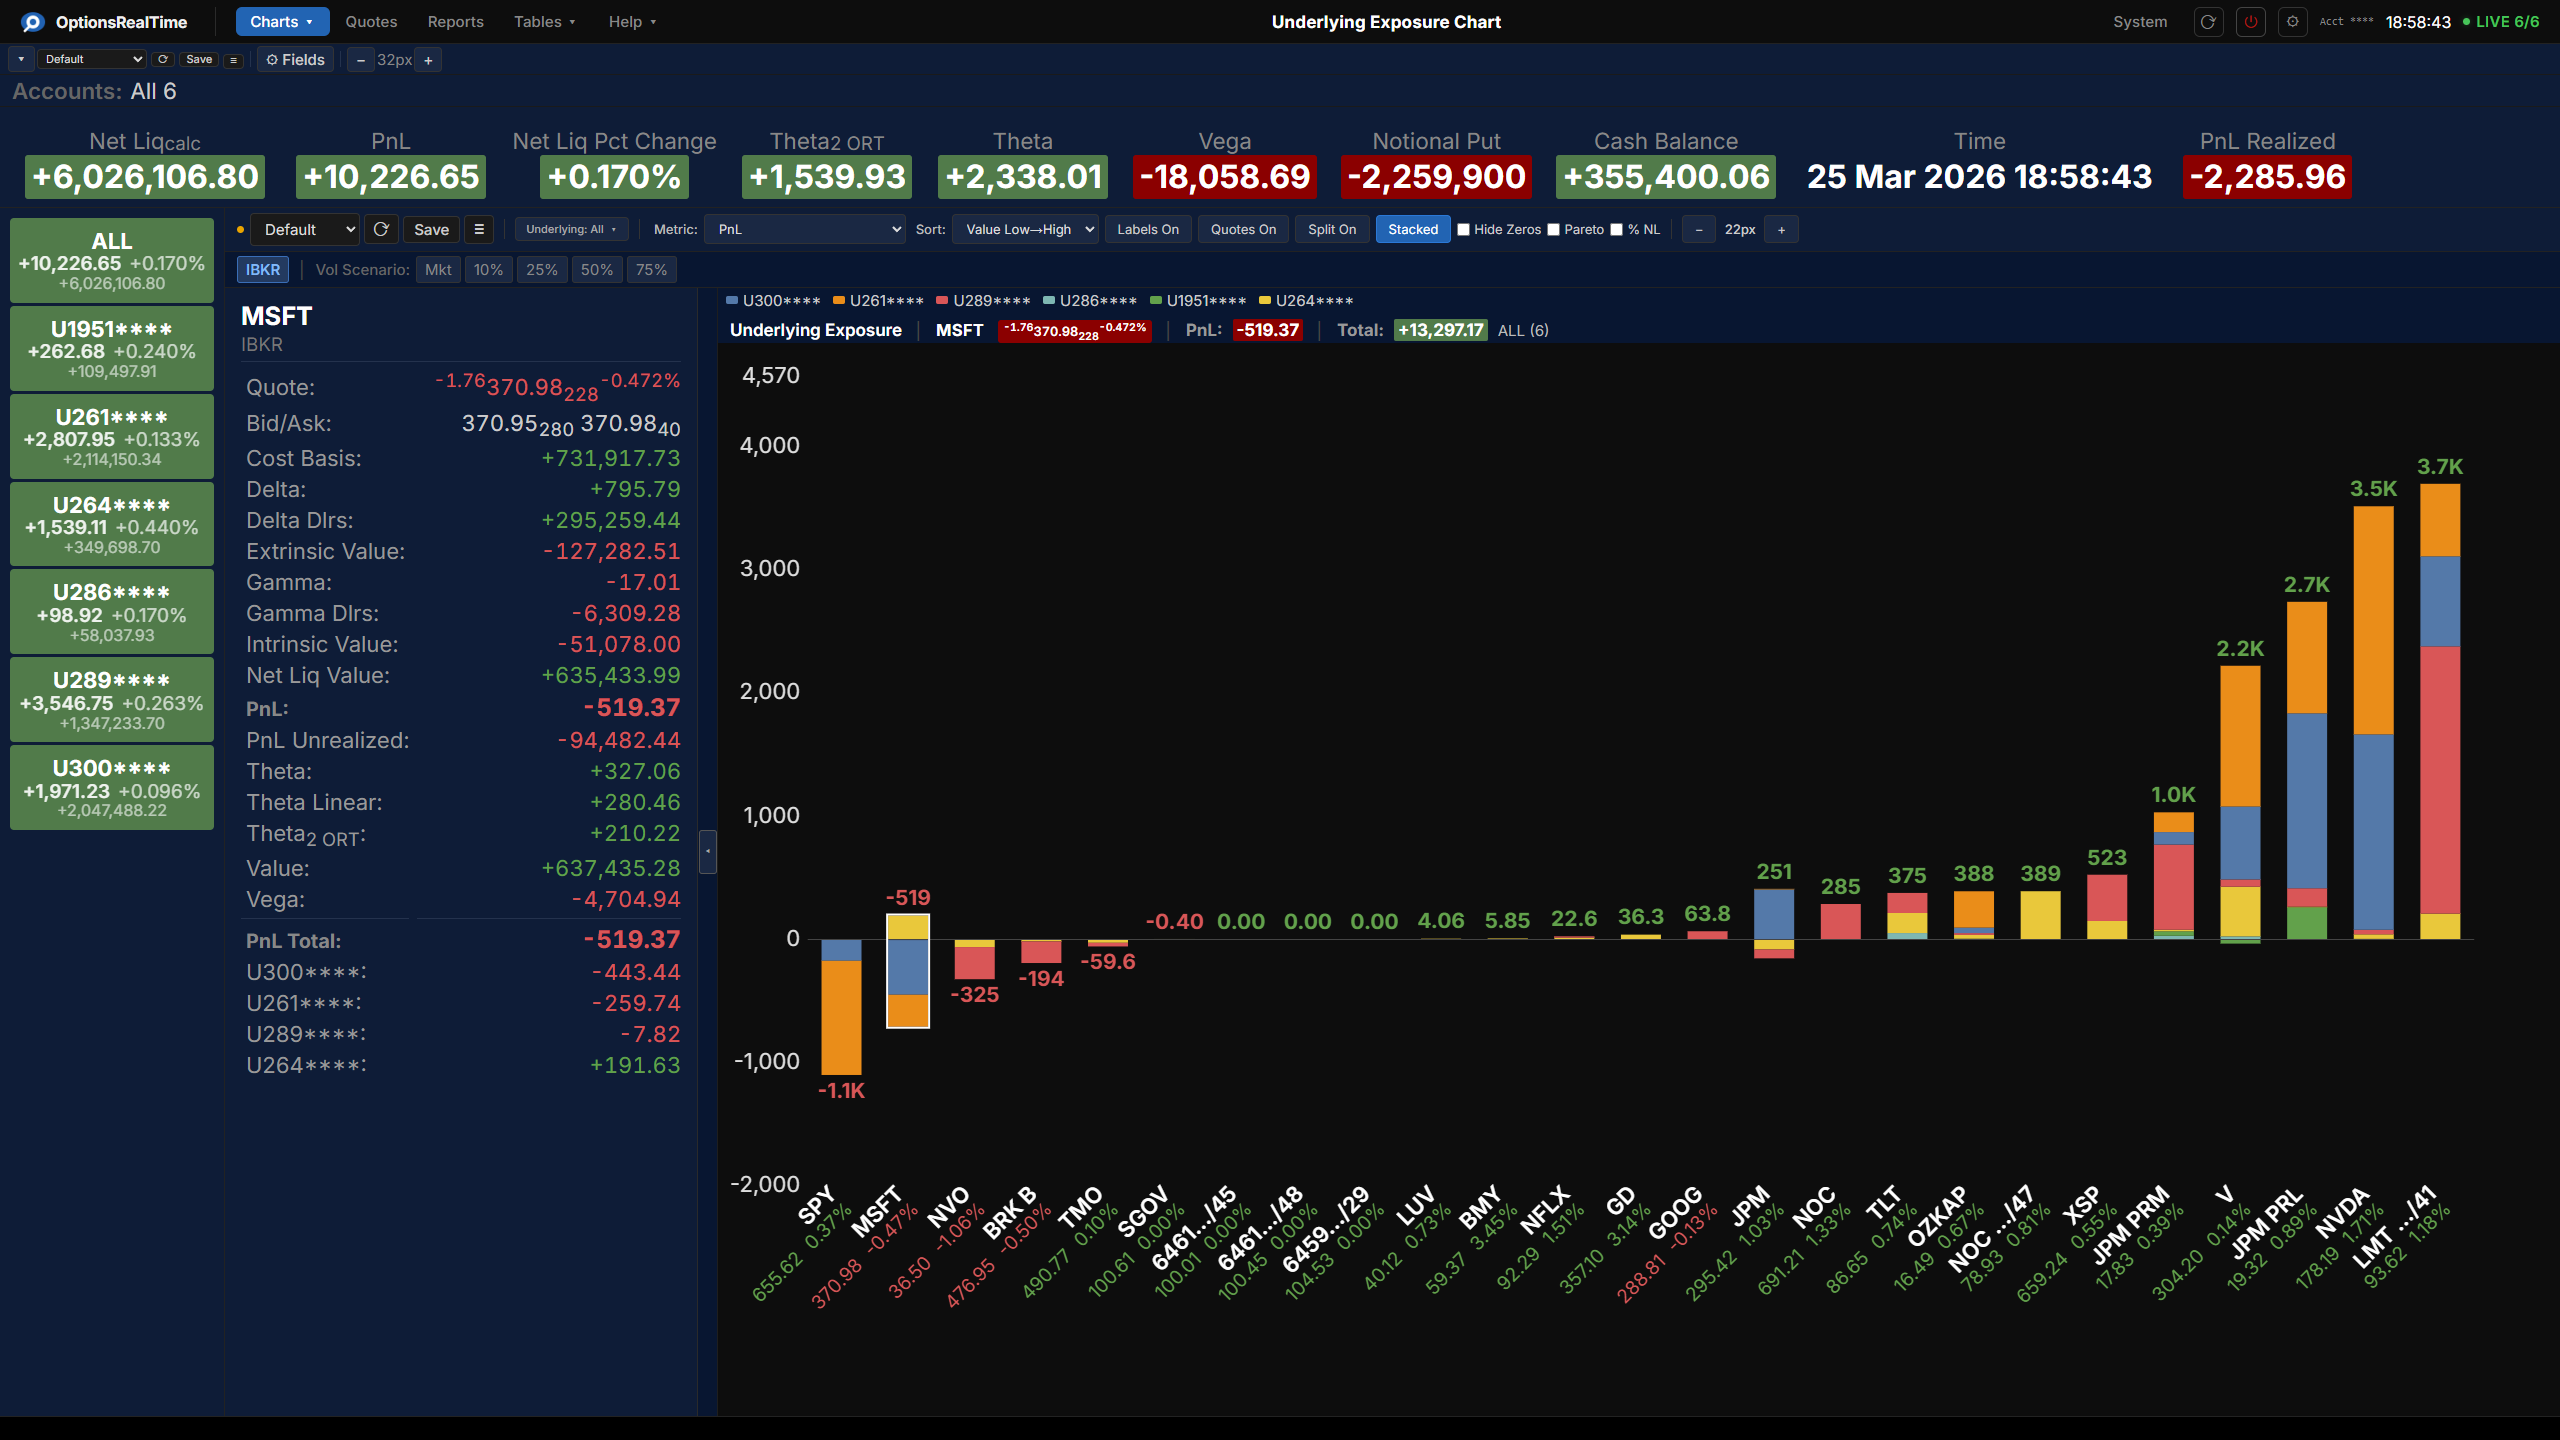
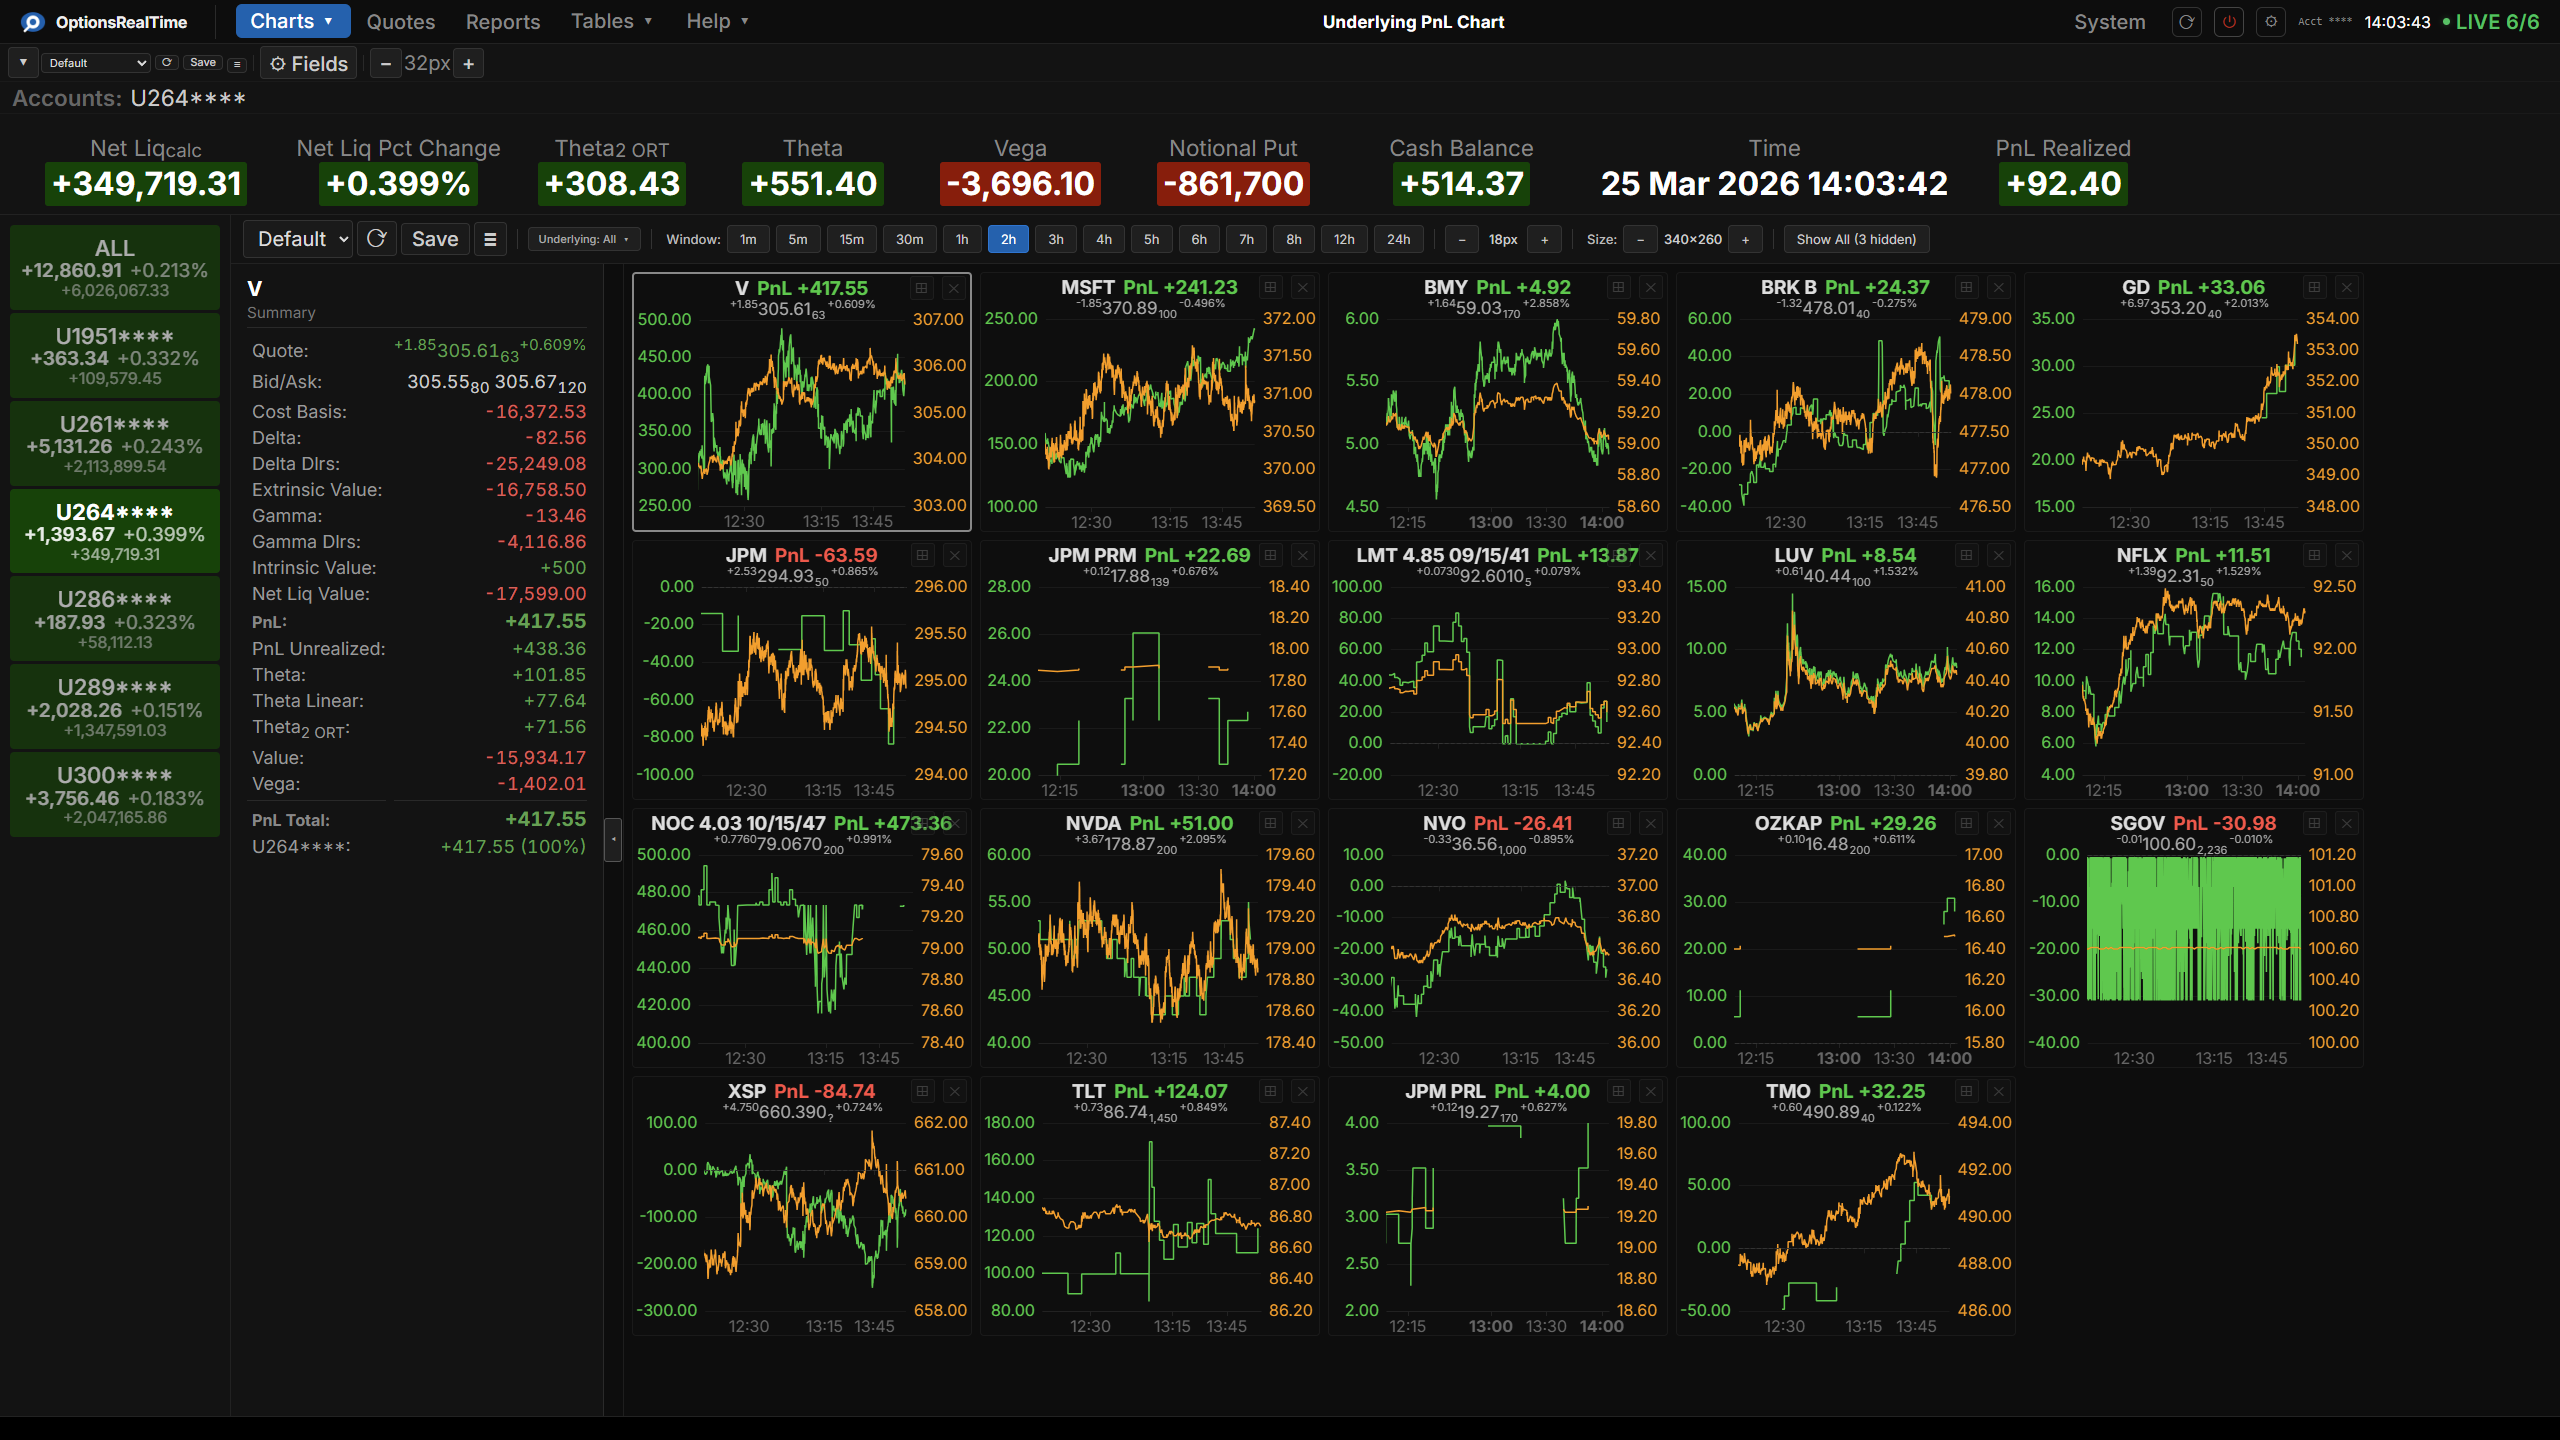
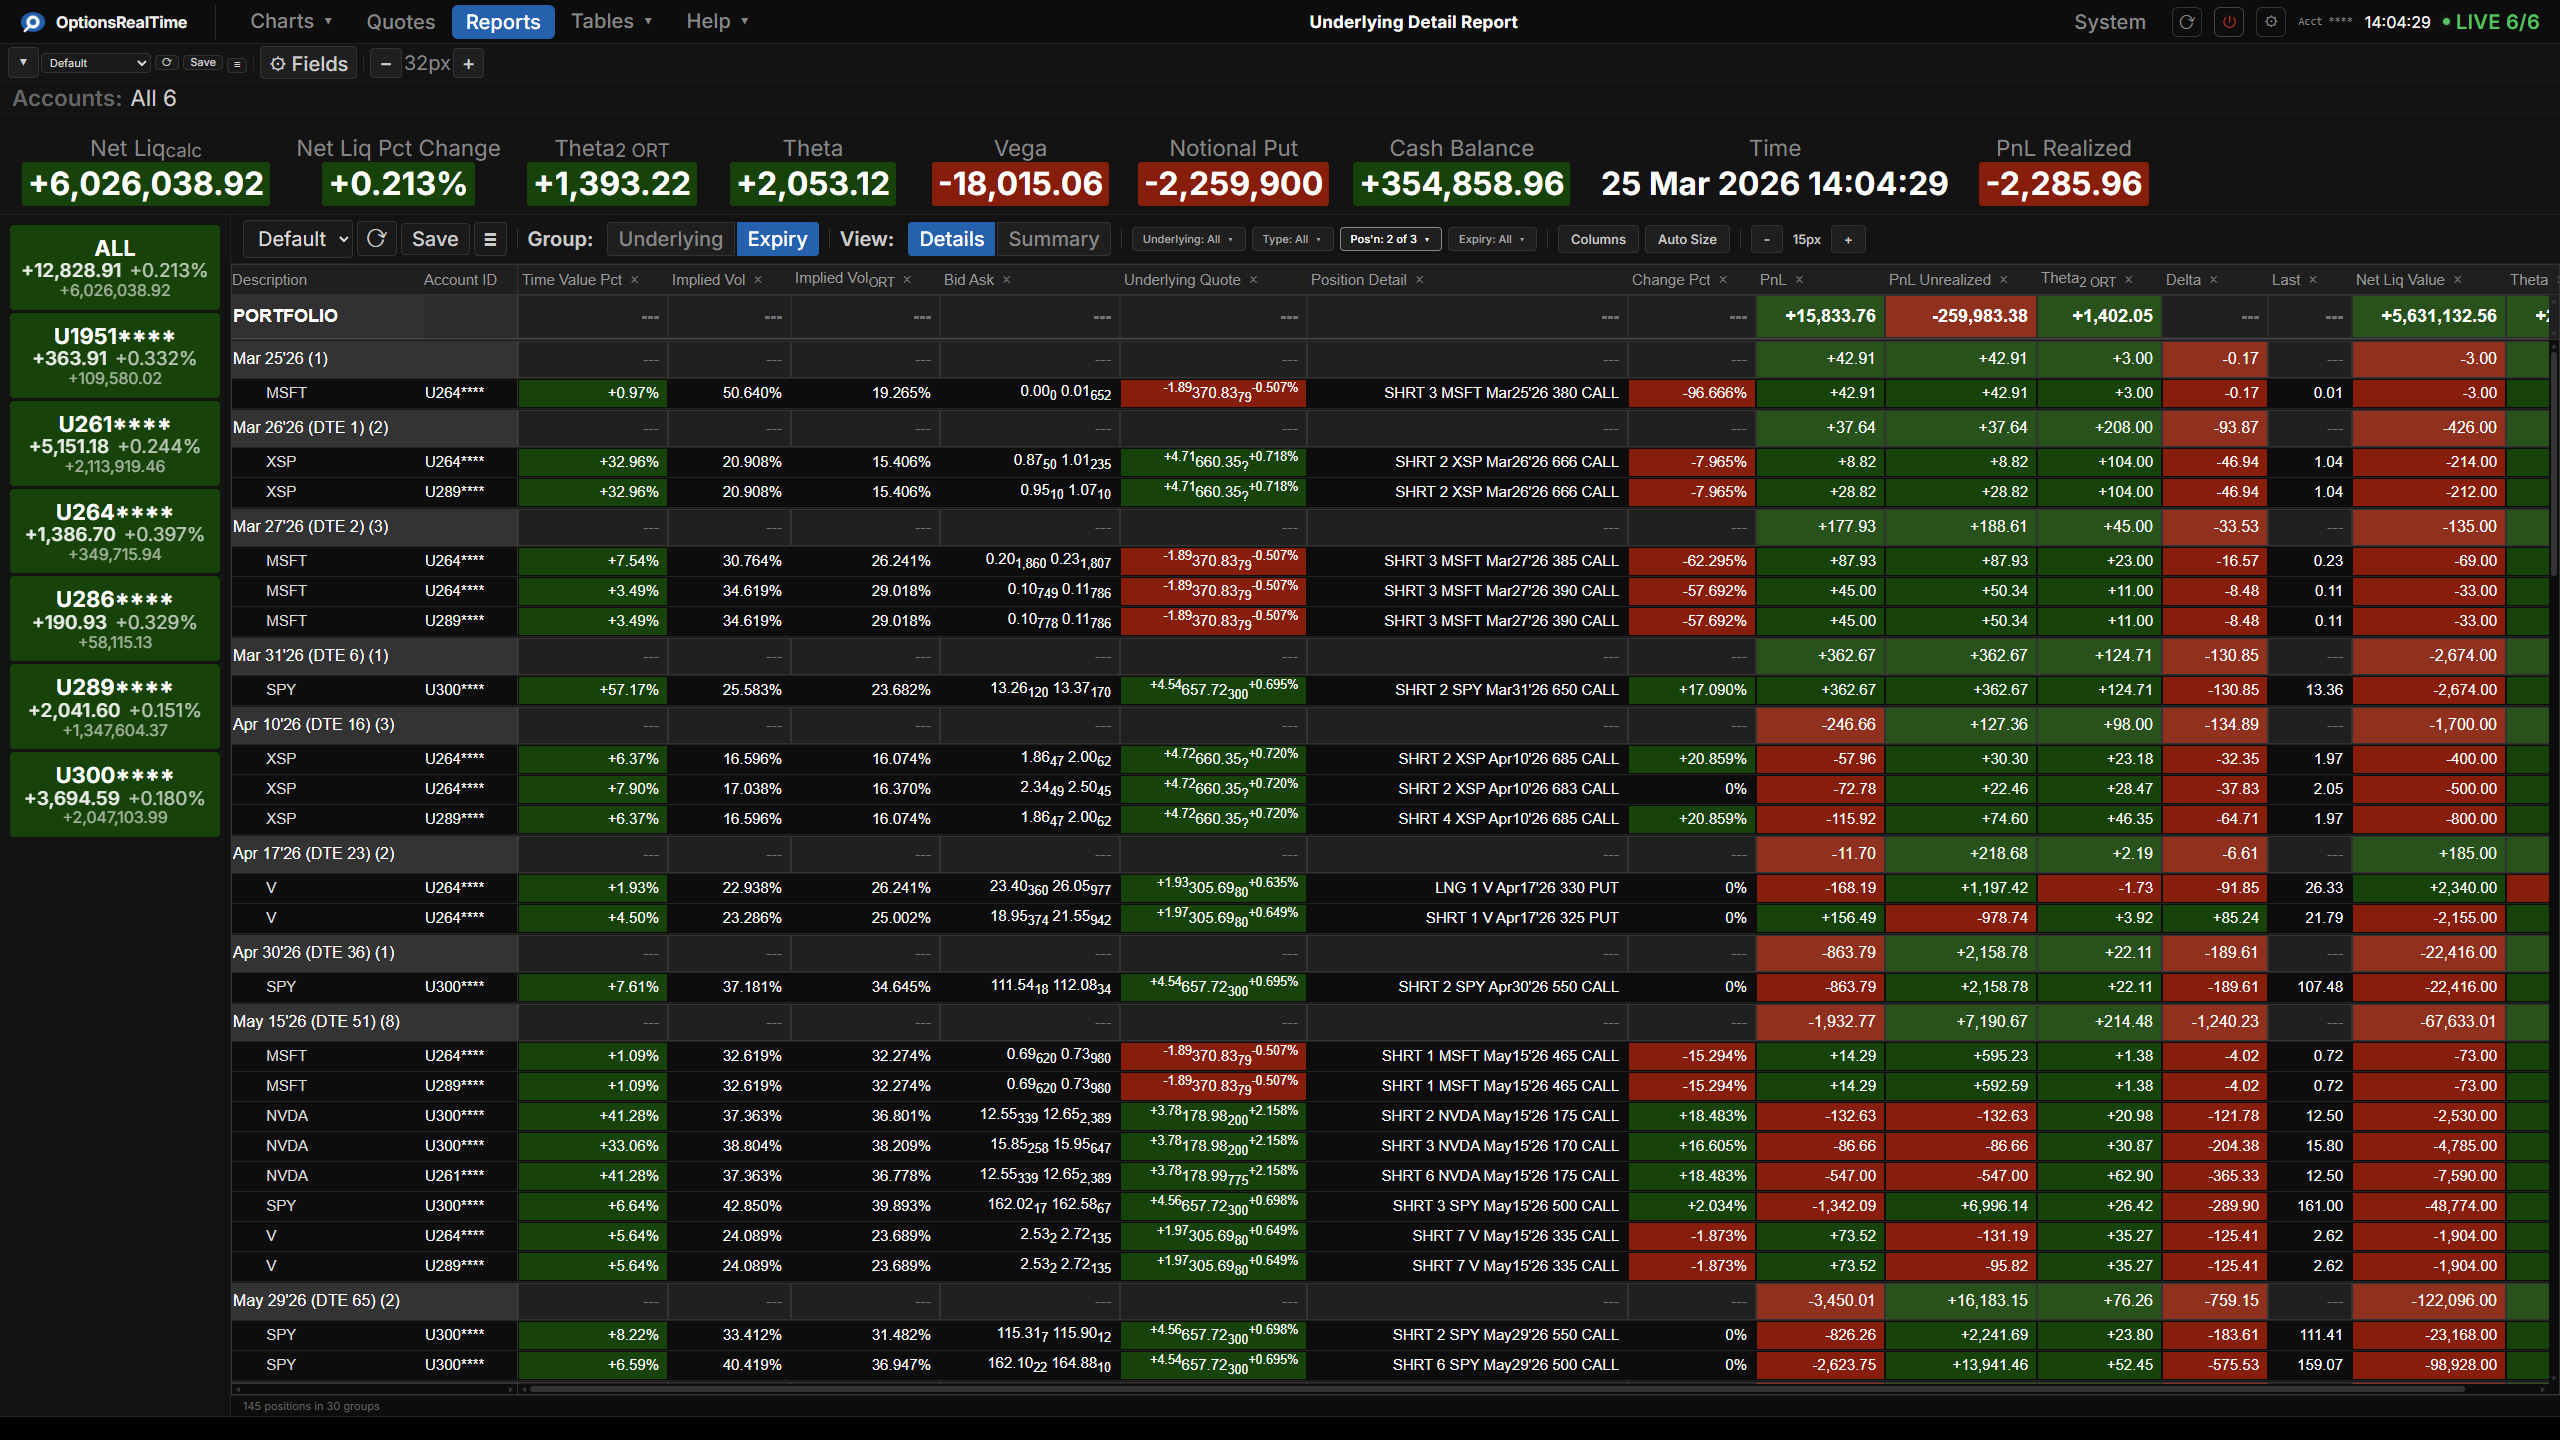
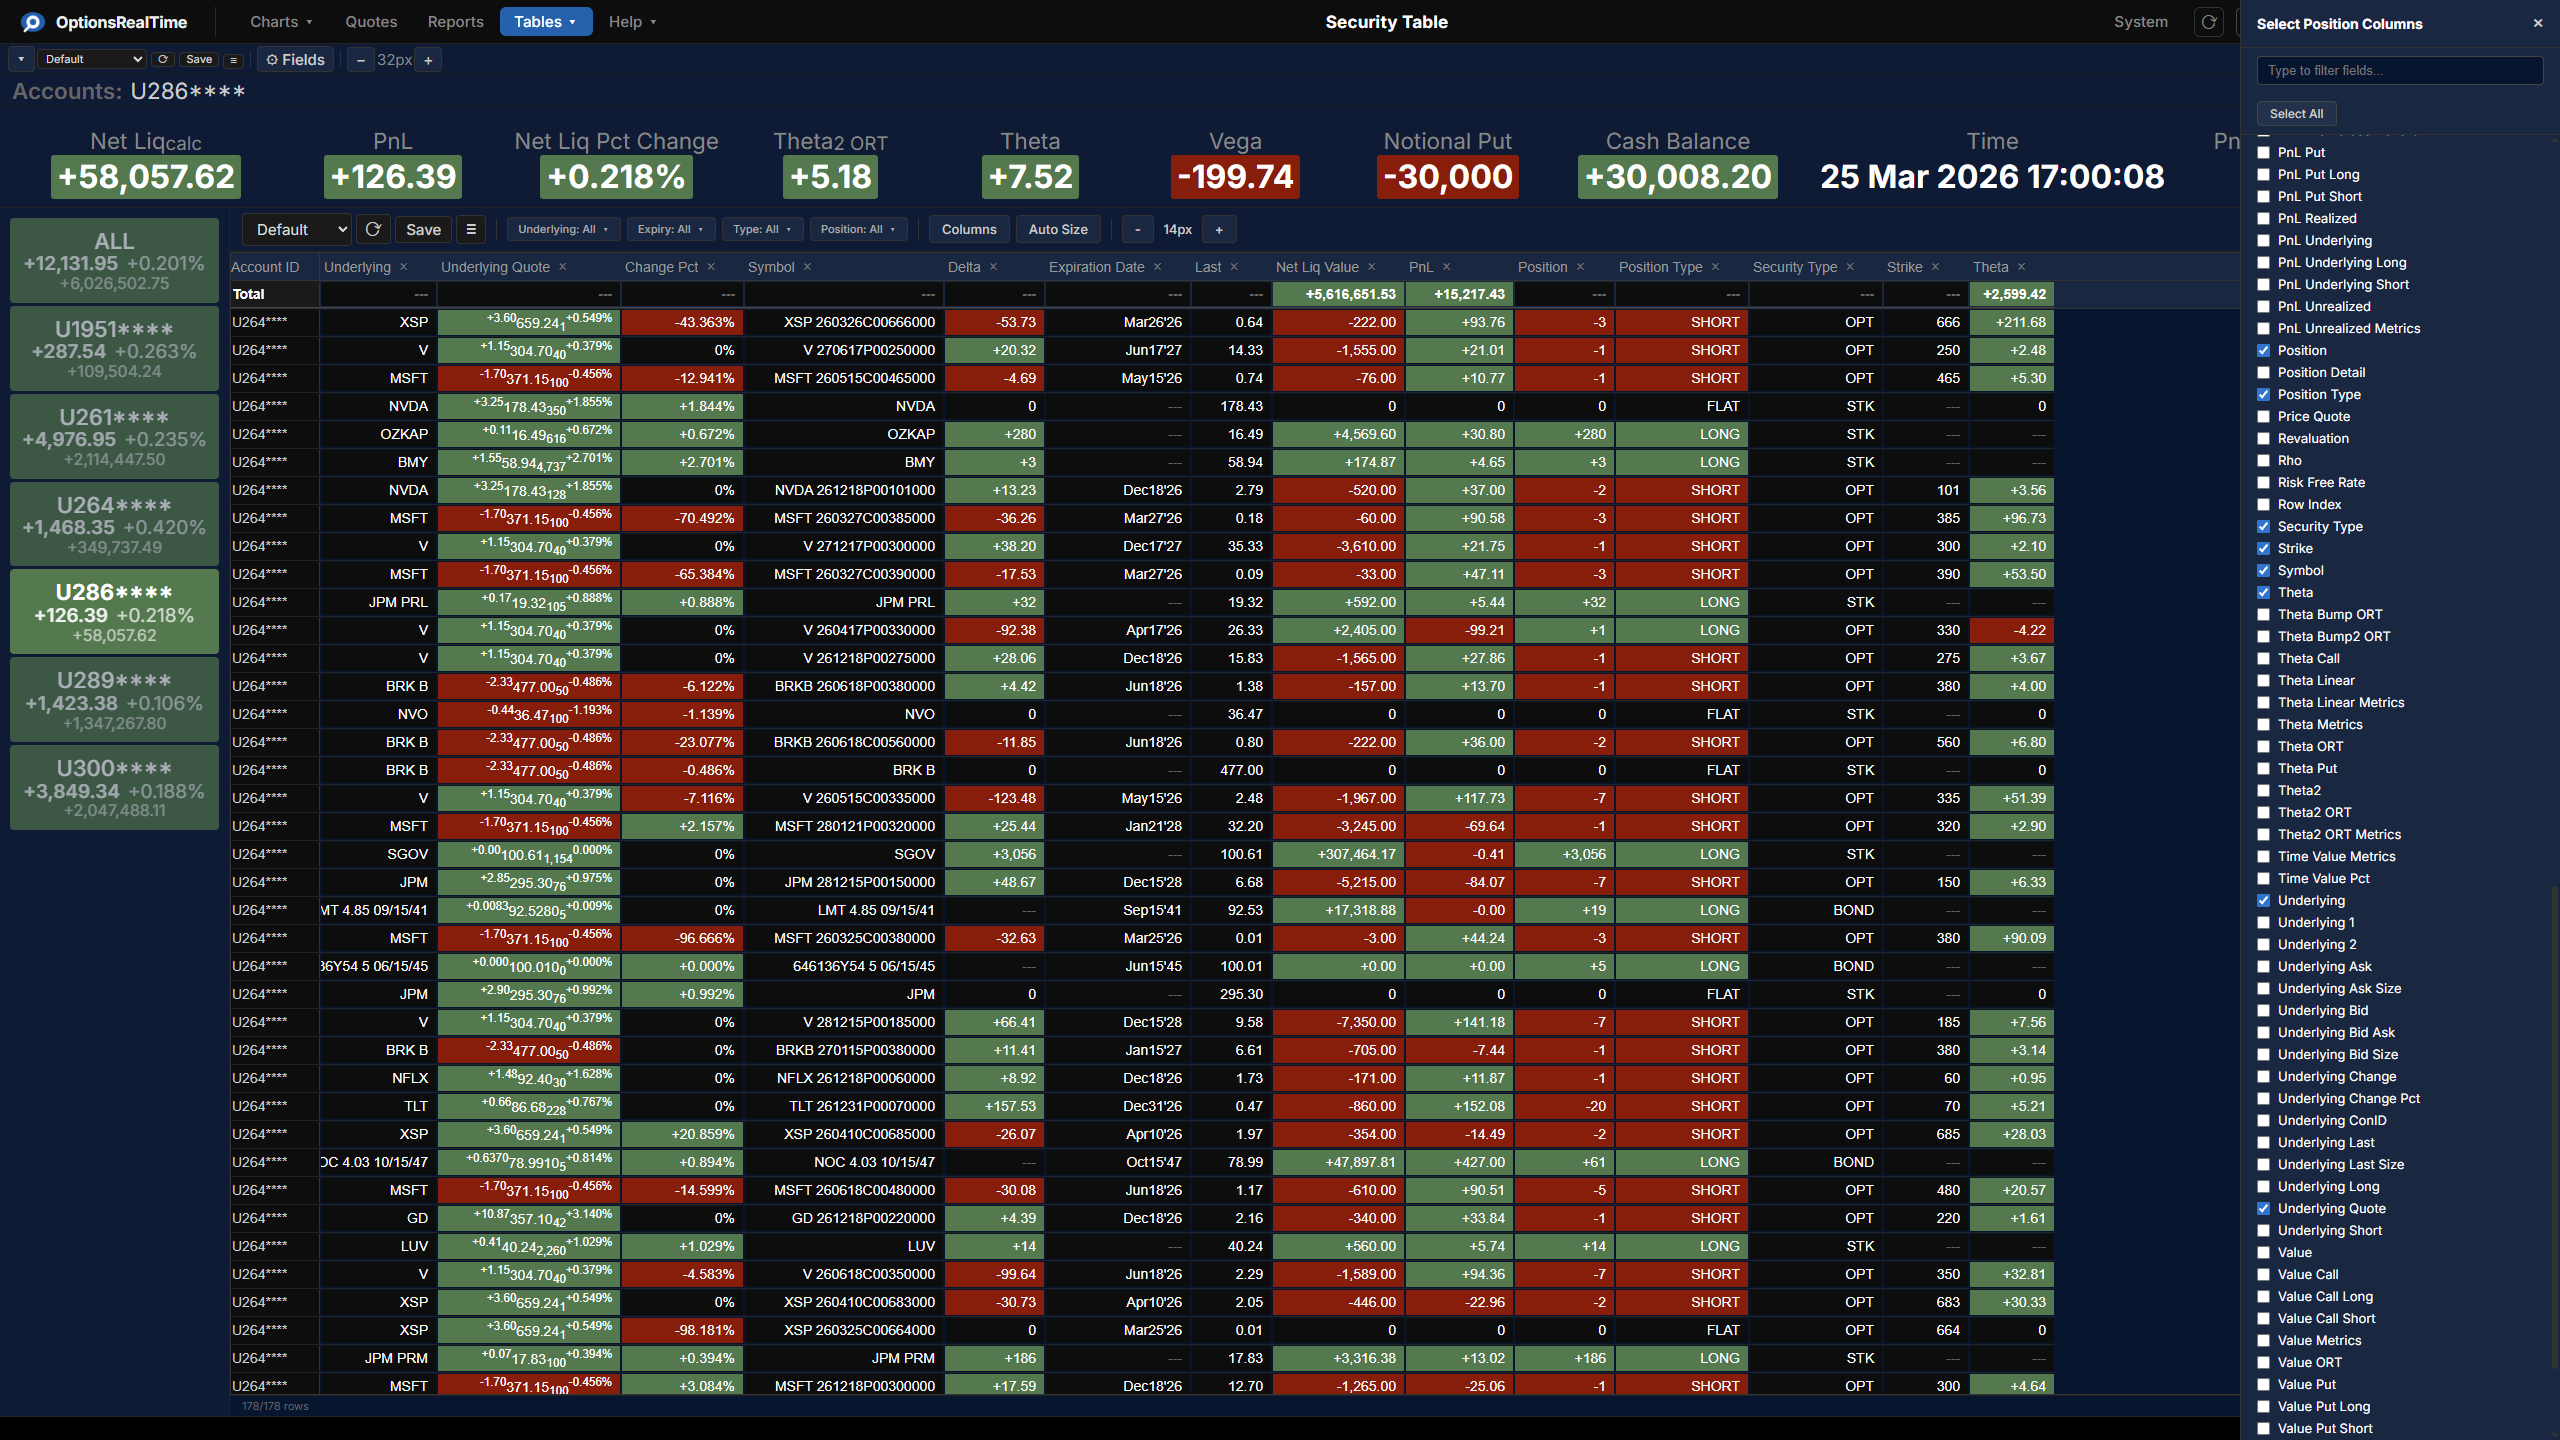
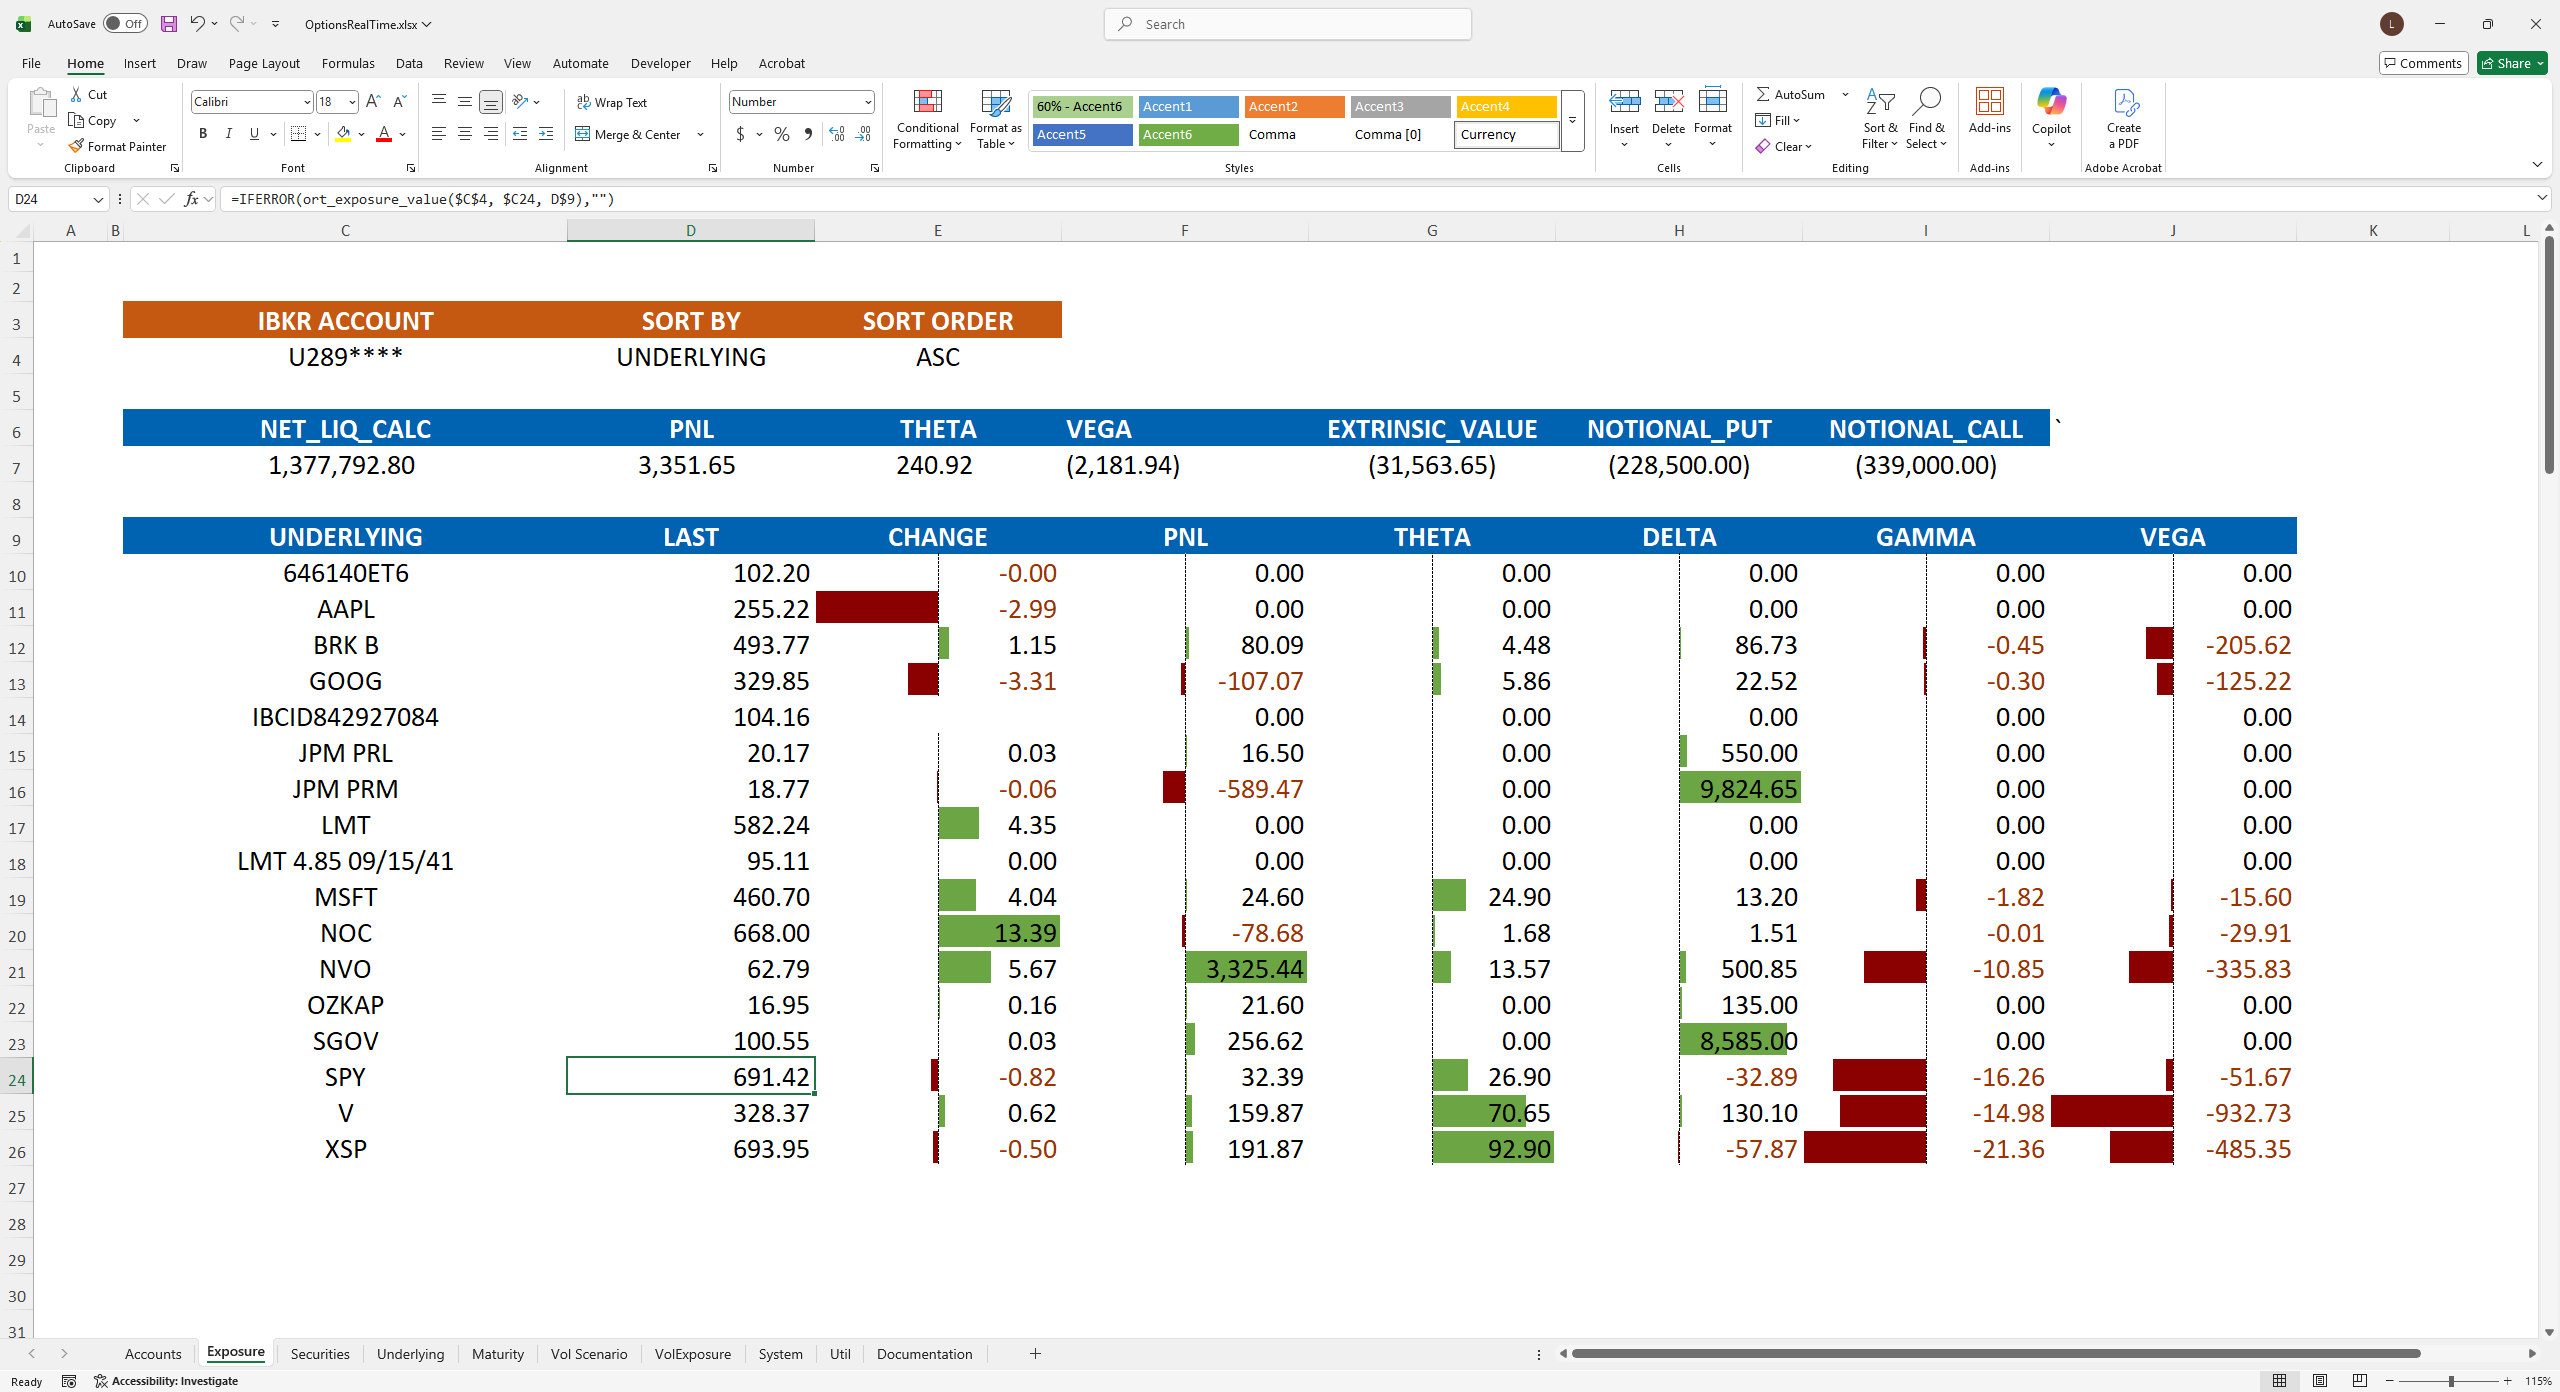
Understanding options risk requires seeing the whole picture, not just individual positions or combinations. Where is your delta or vega exposure? How much theta are you collecting? Is that risk concentrated by underlying or expiration? Tables of individual positions make these questions difficult to answer.
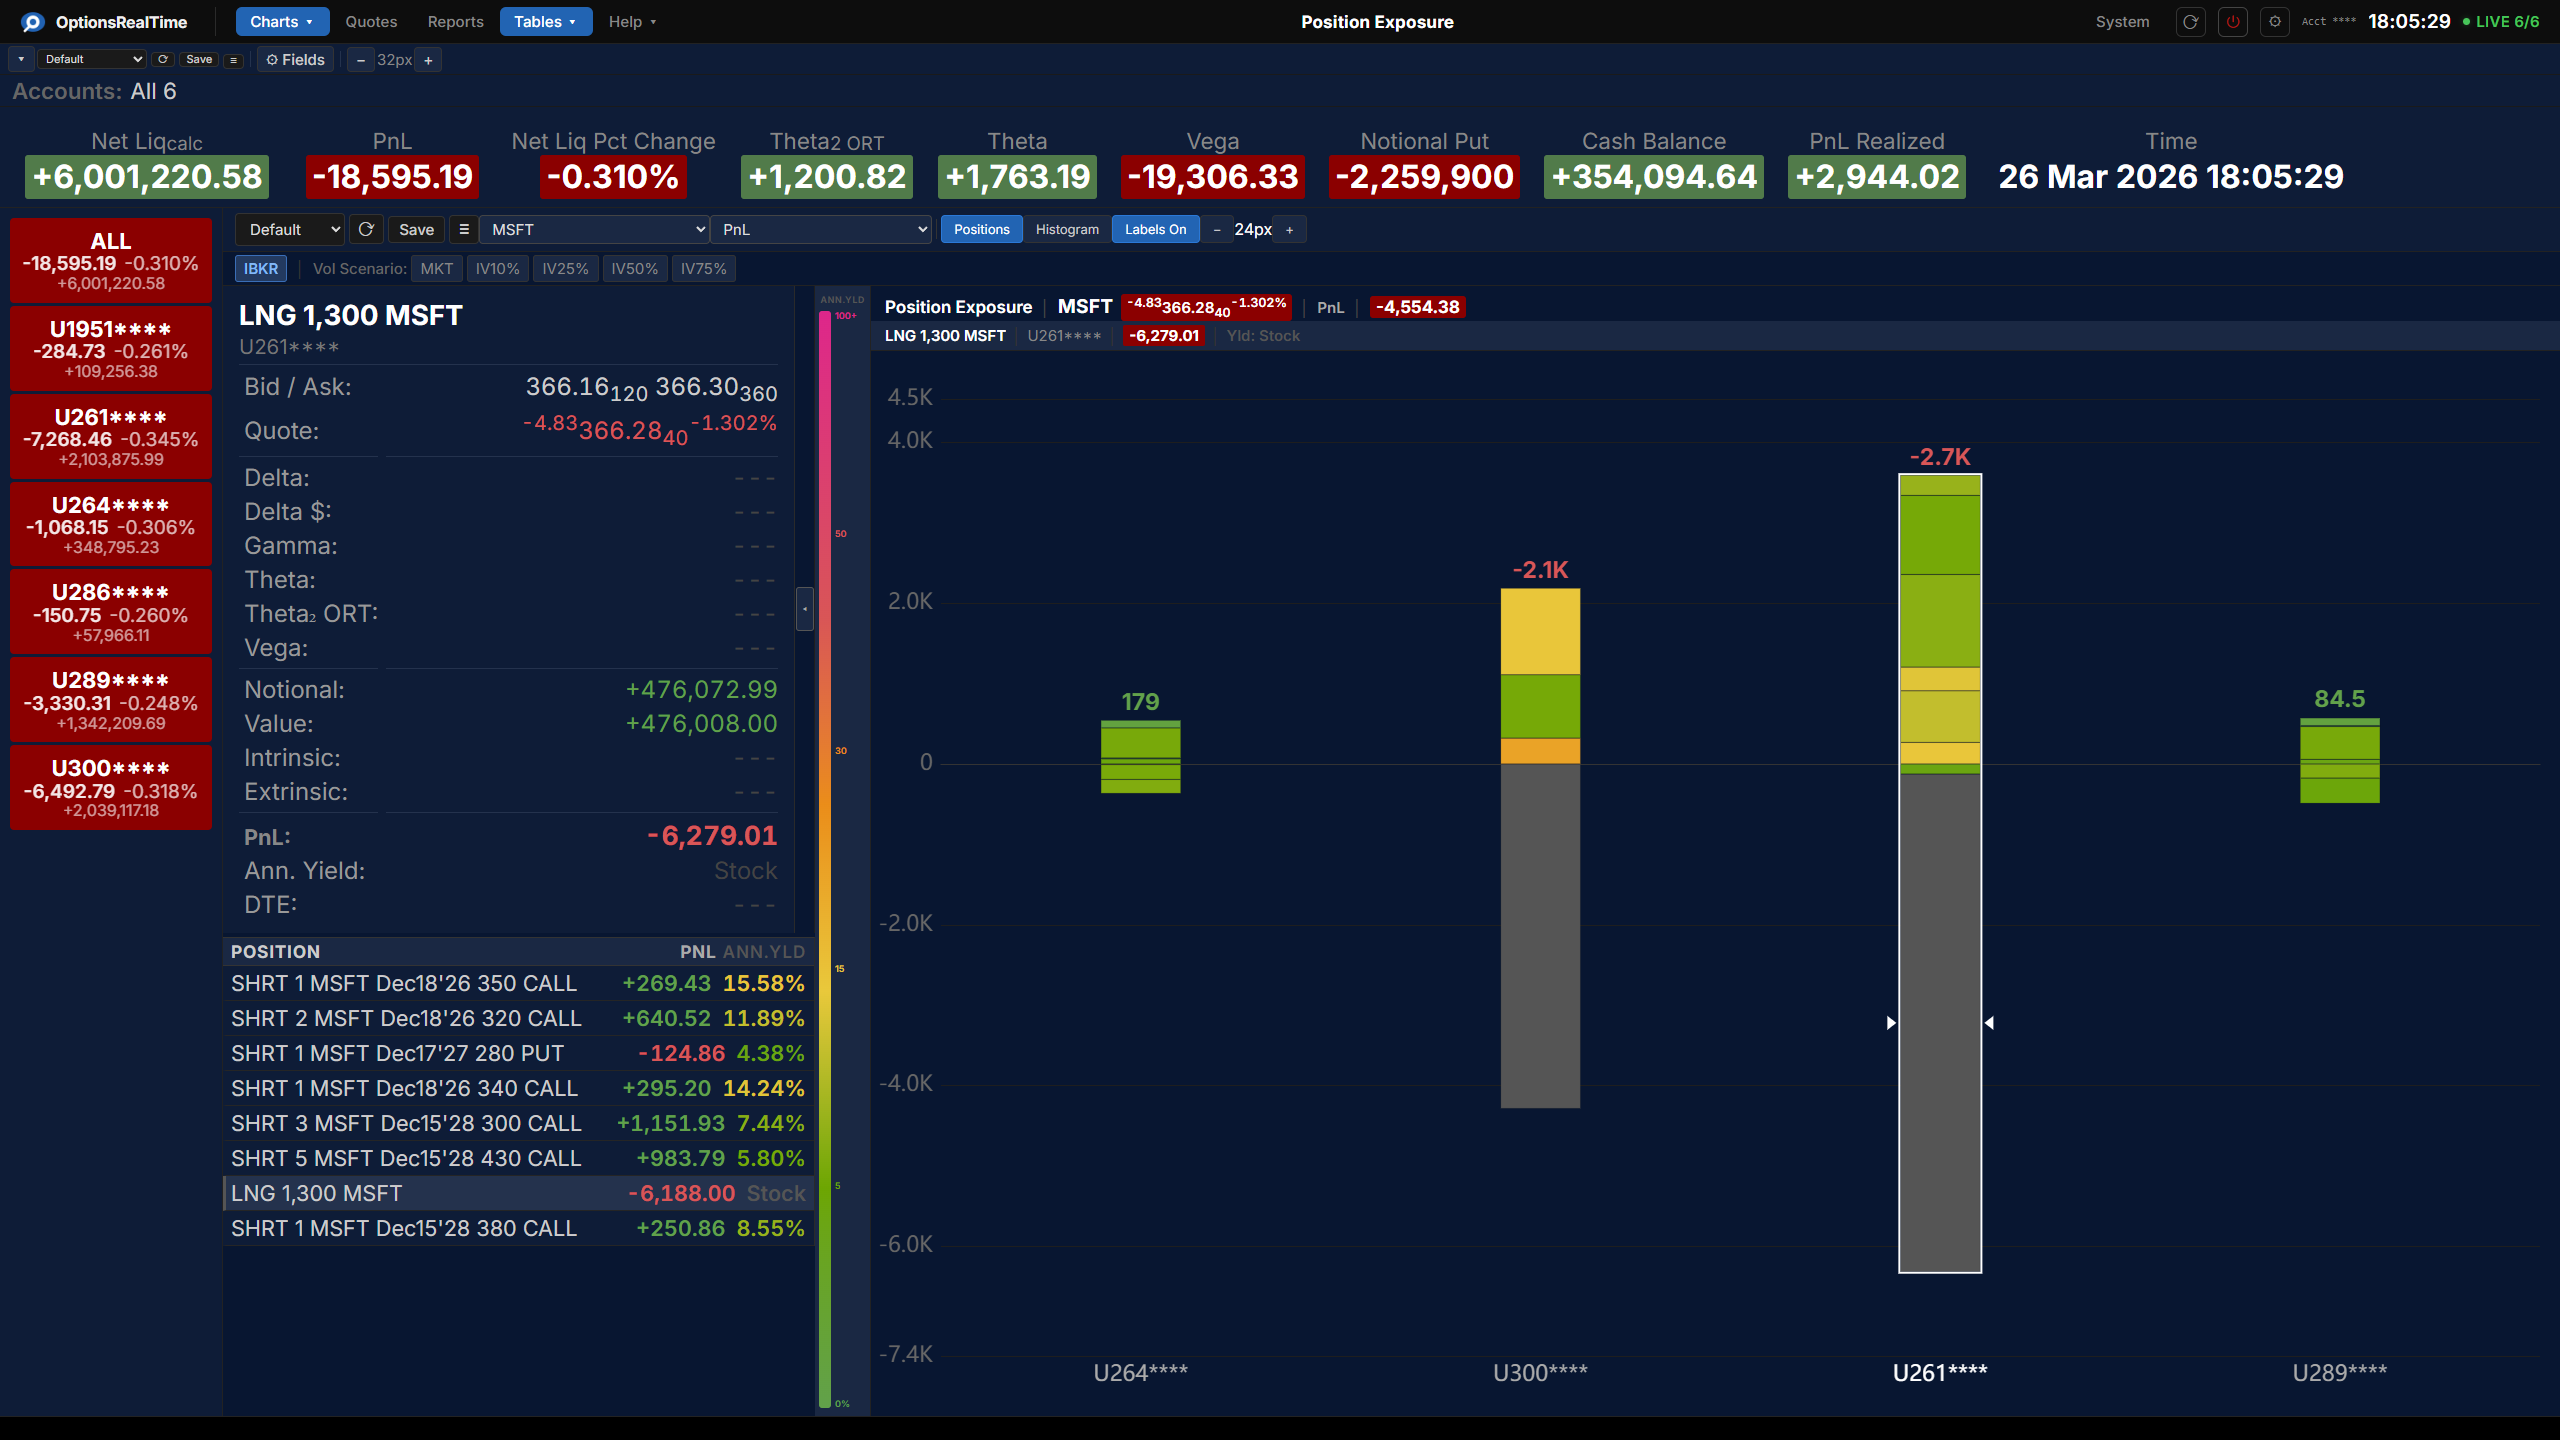
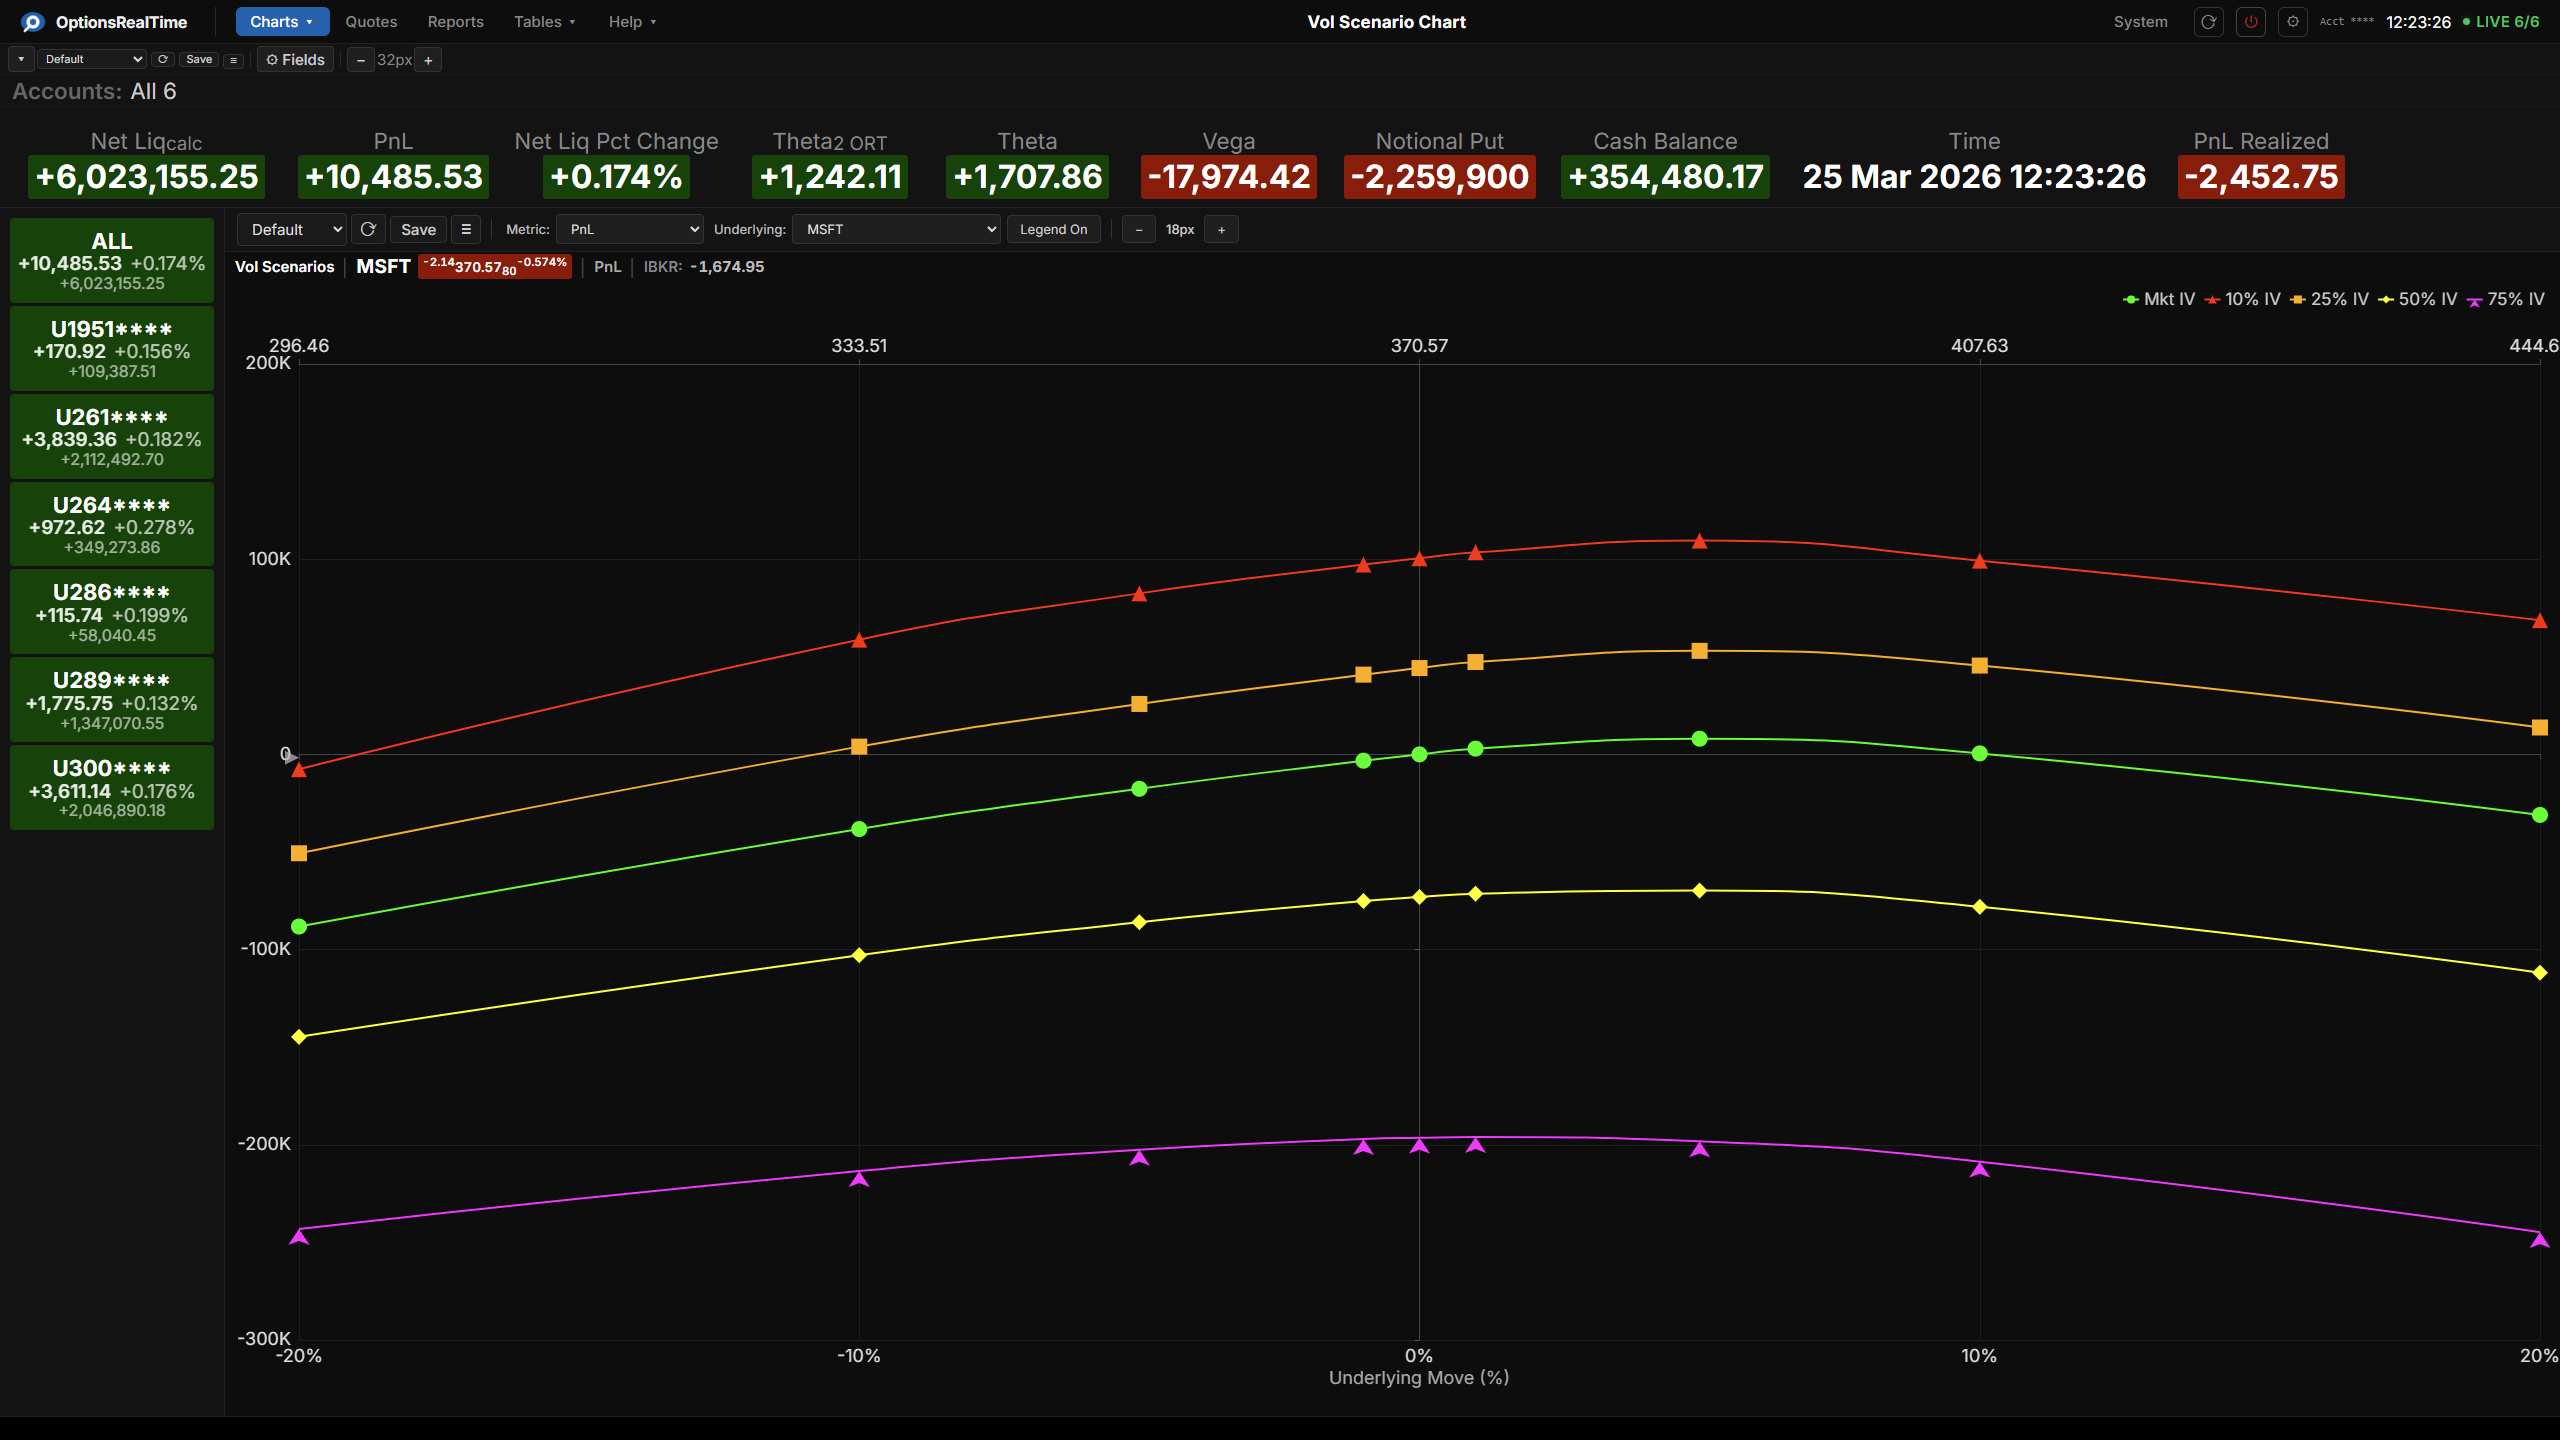
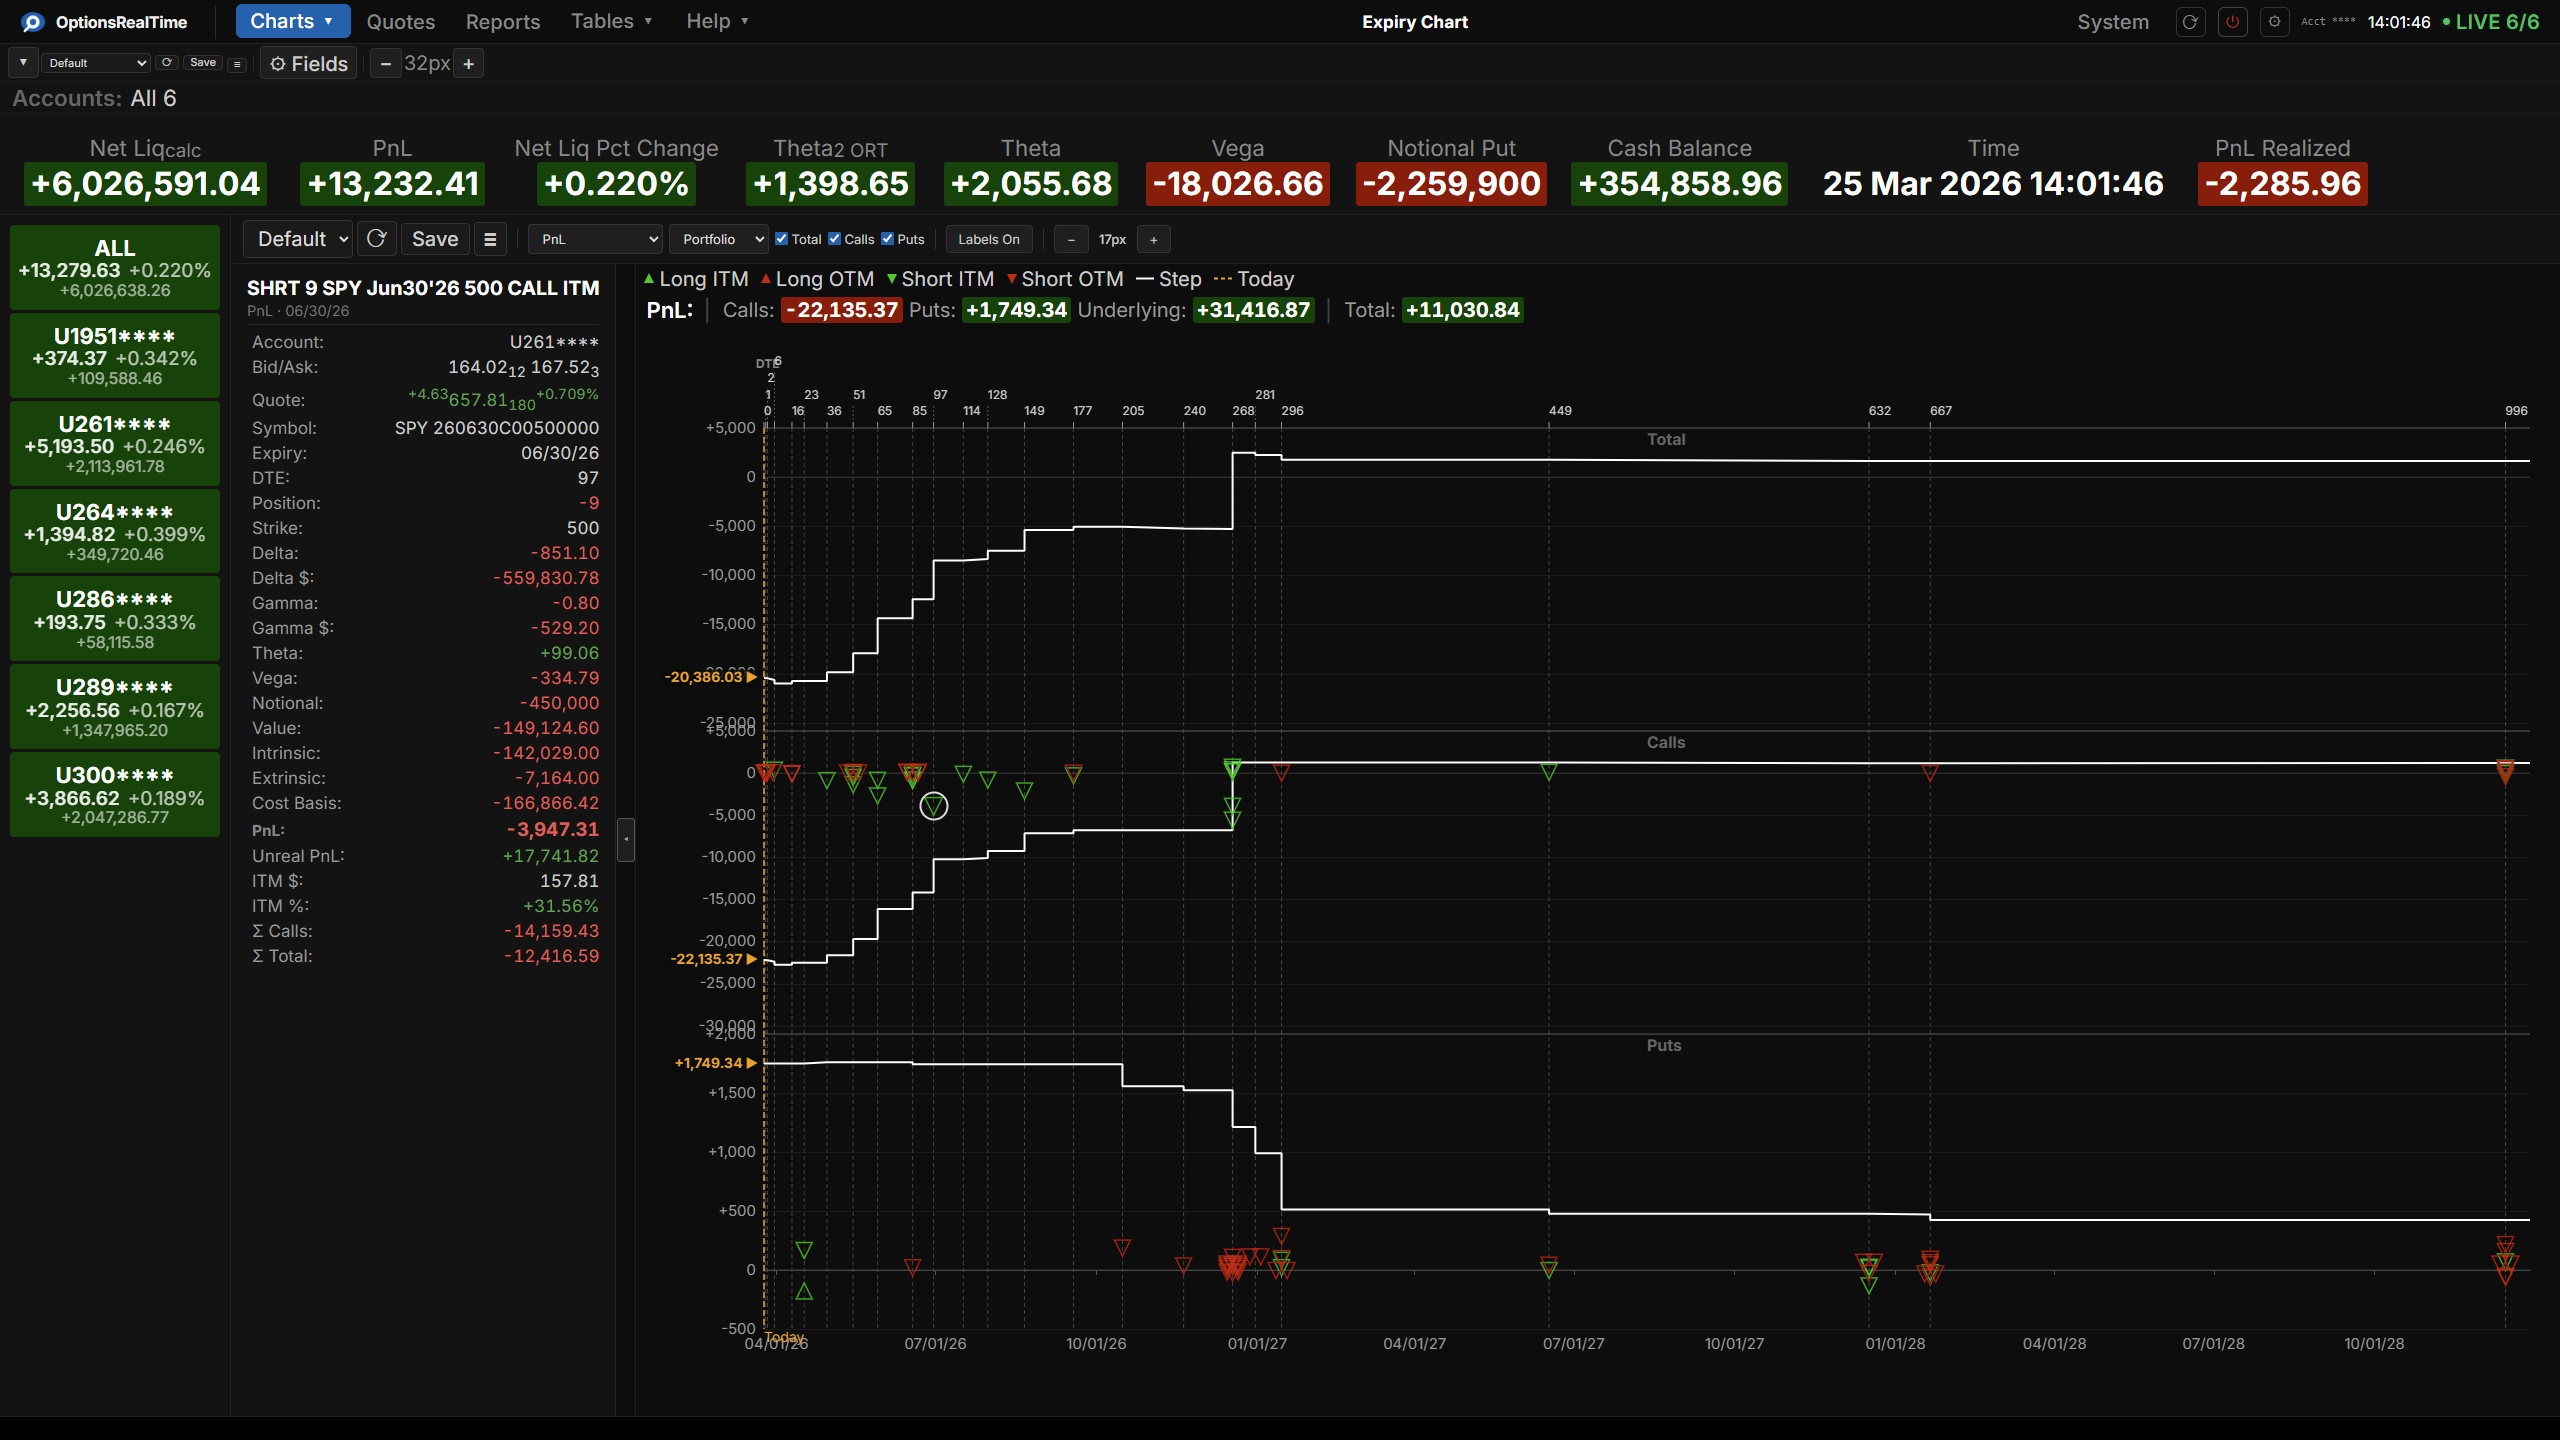
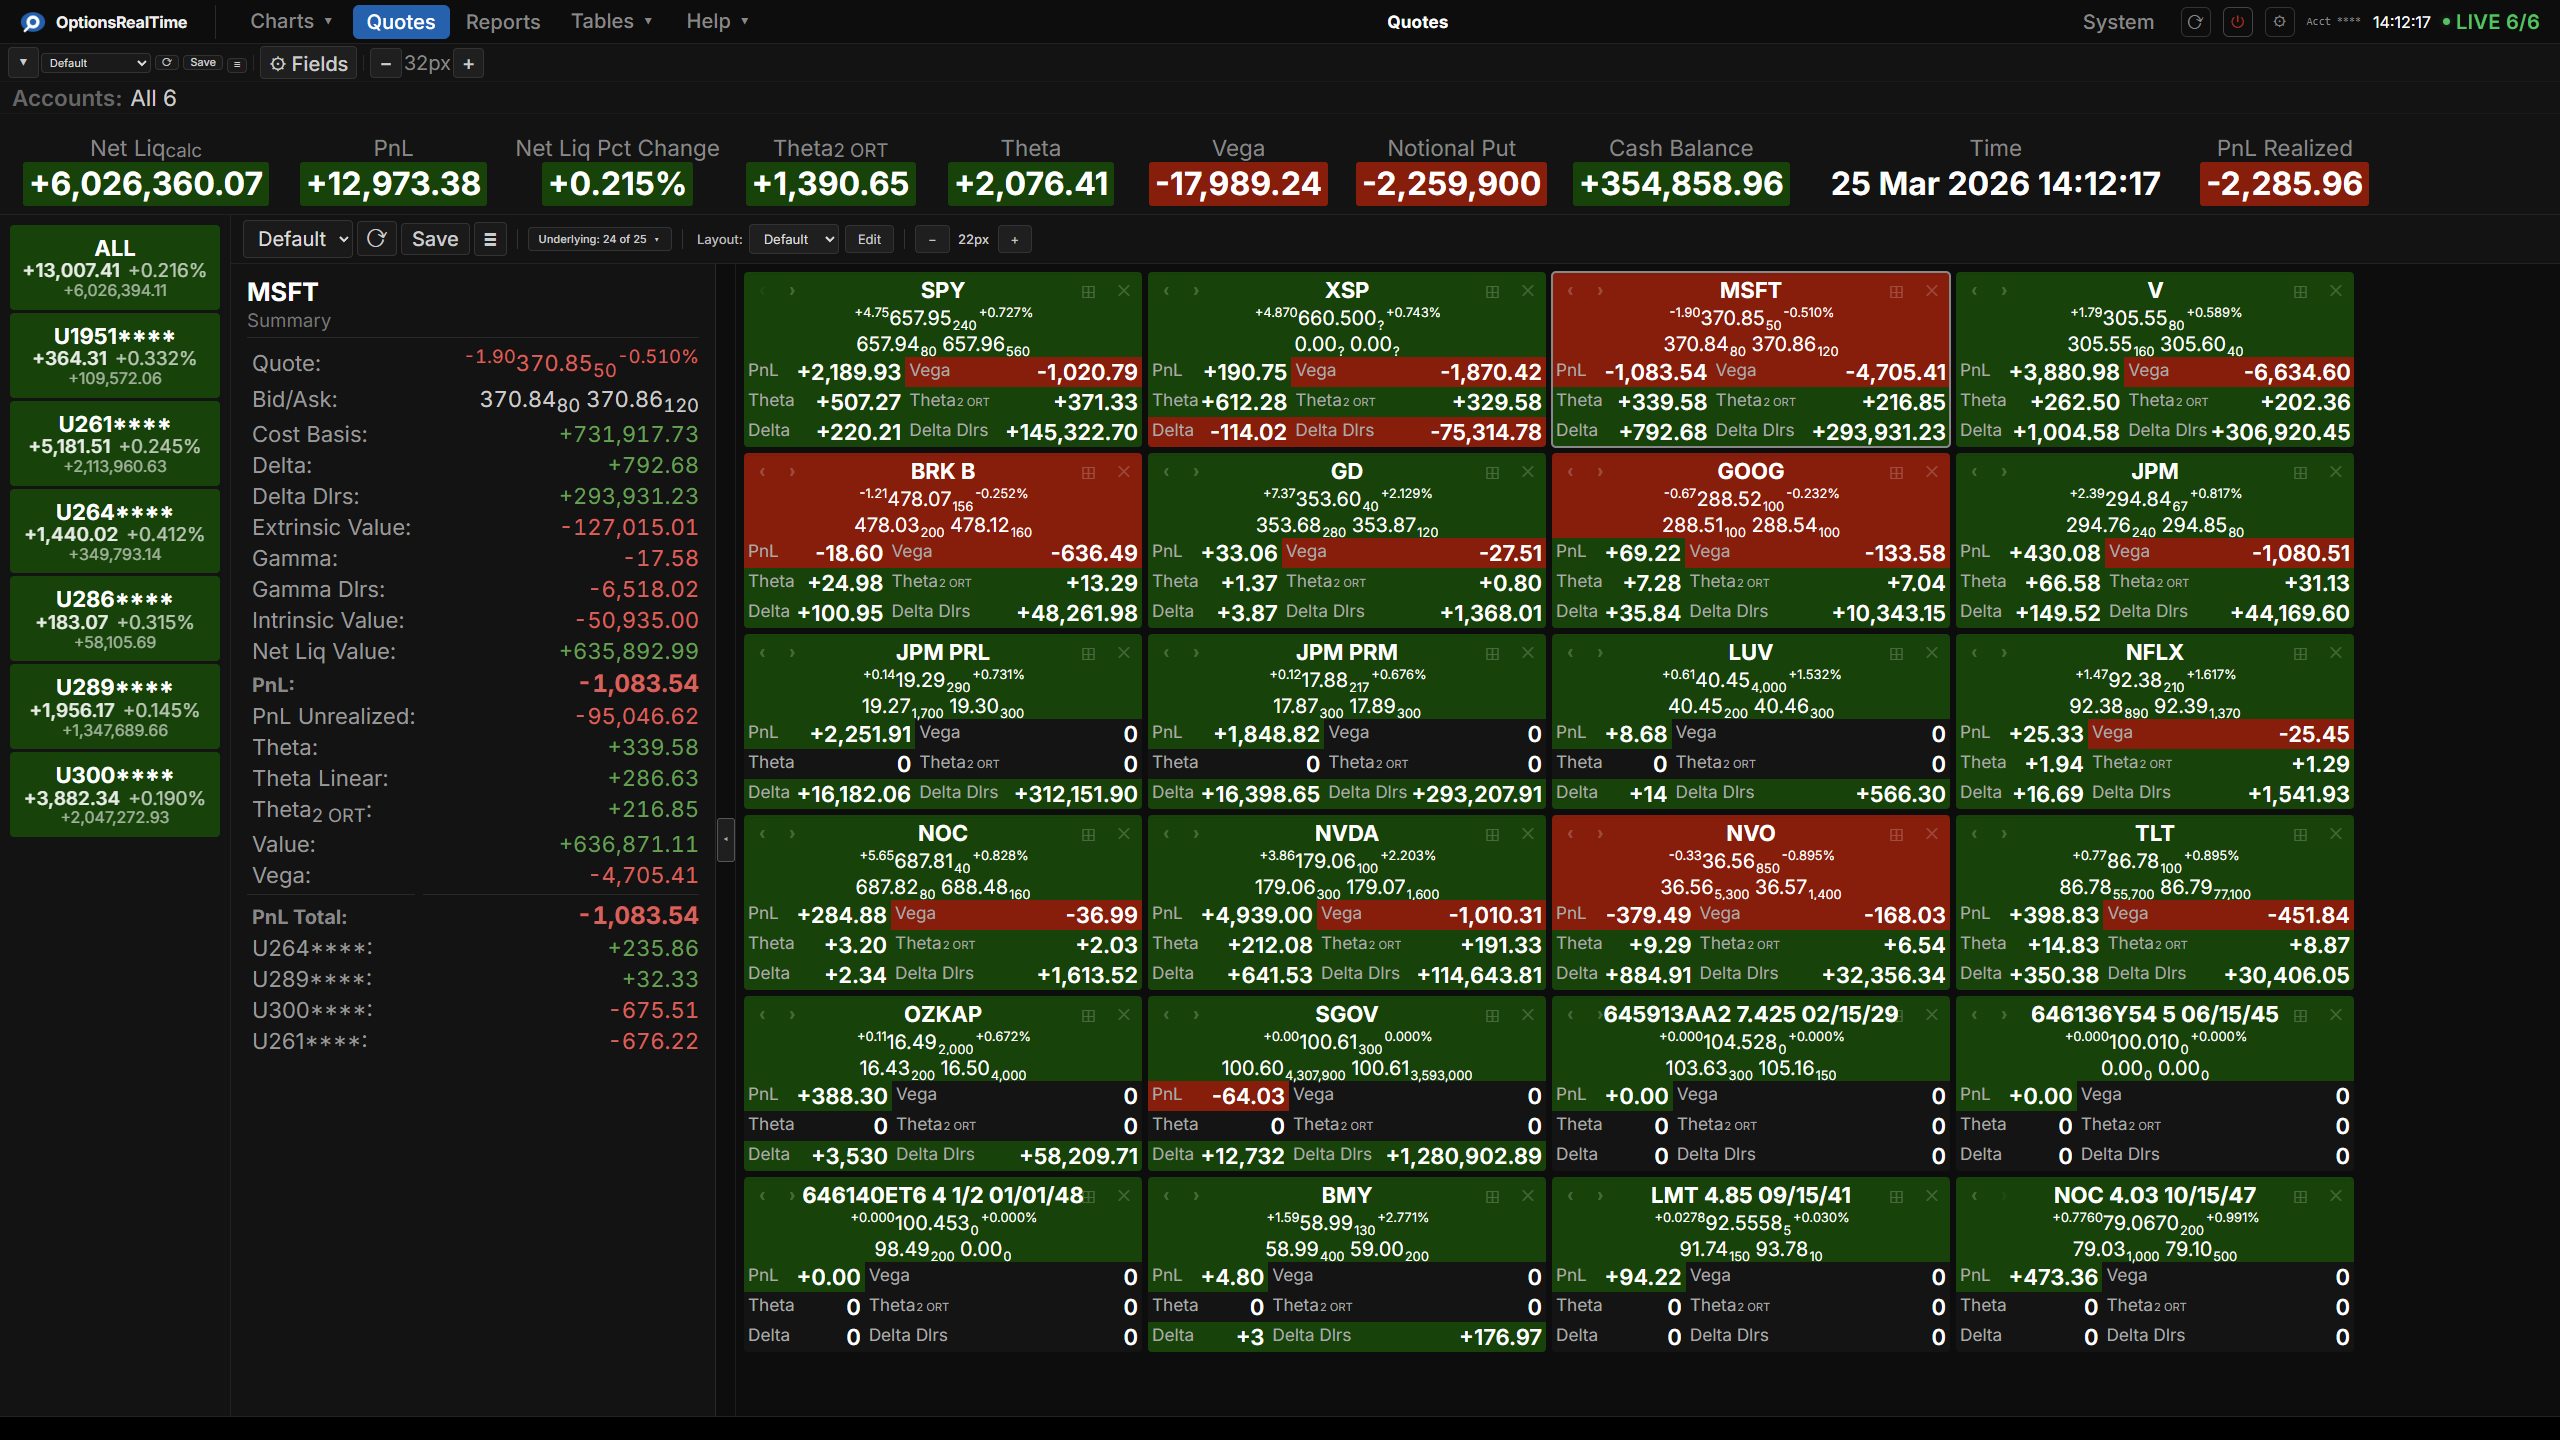
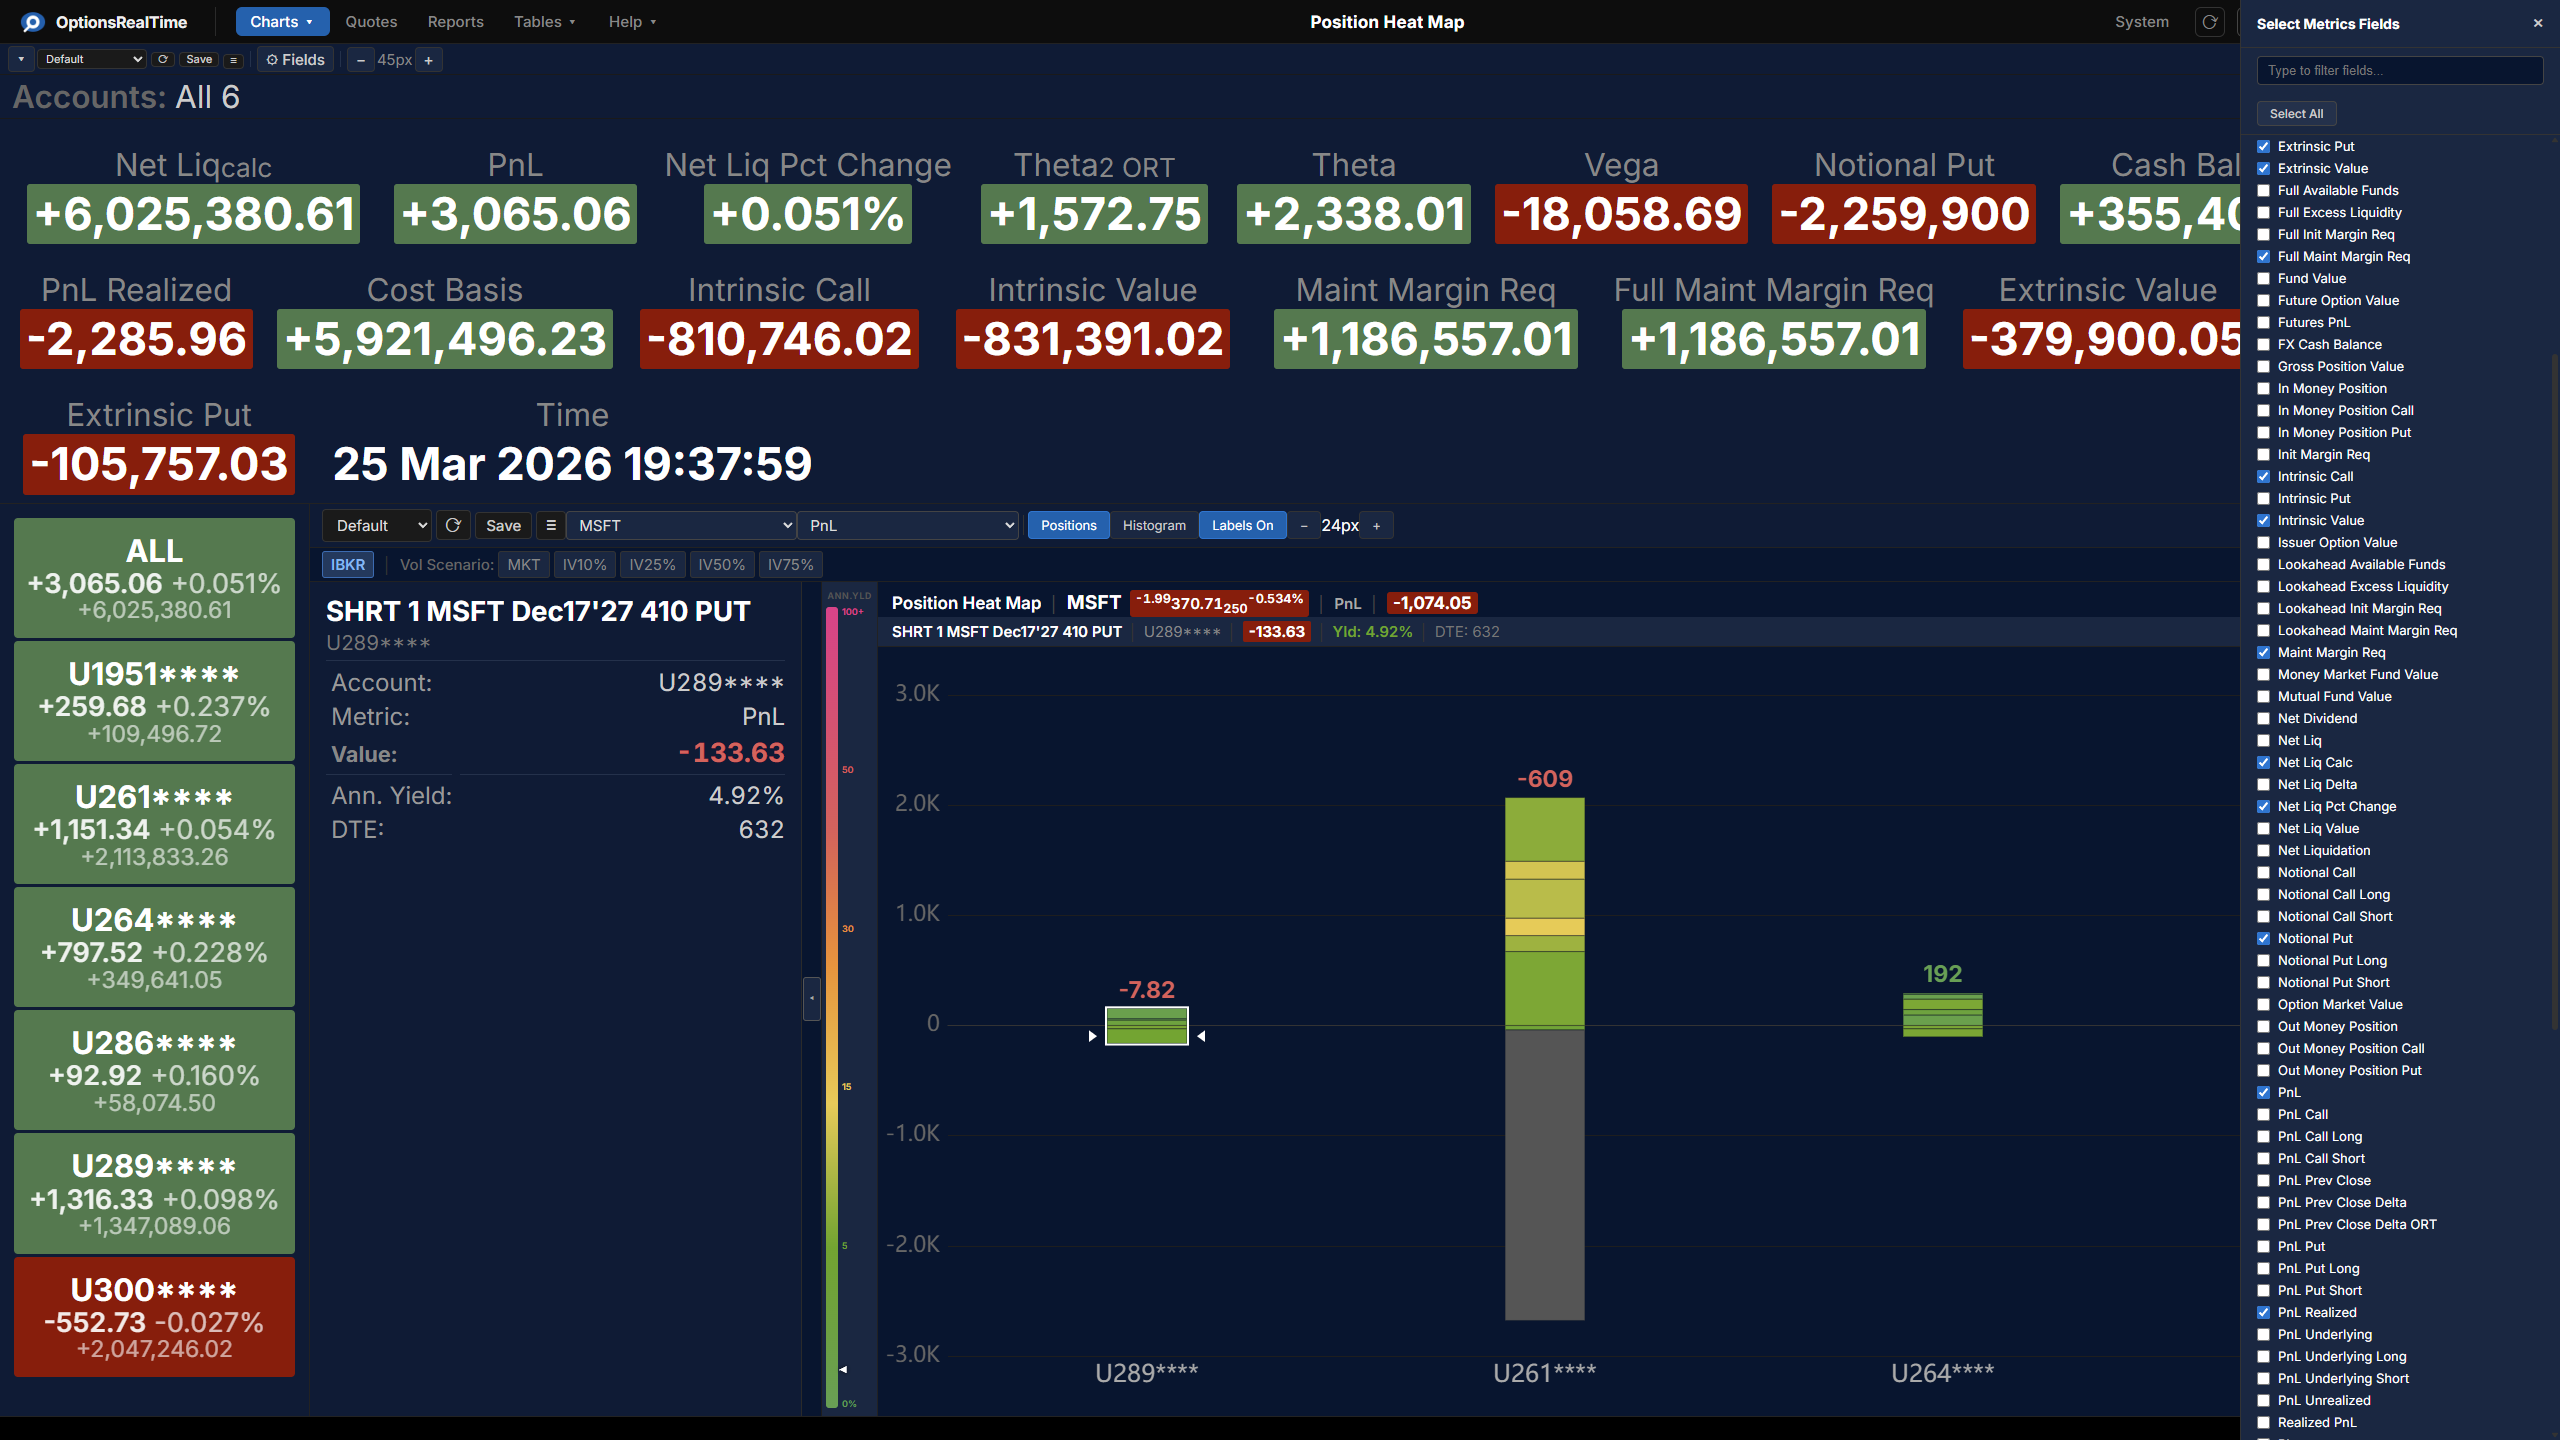
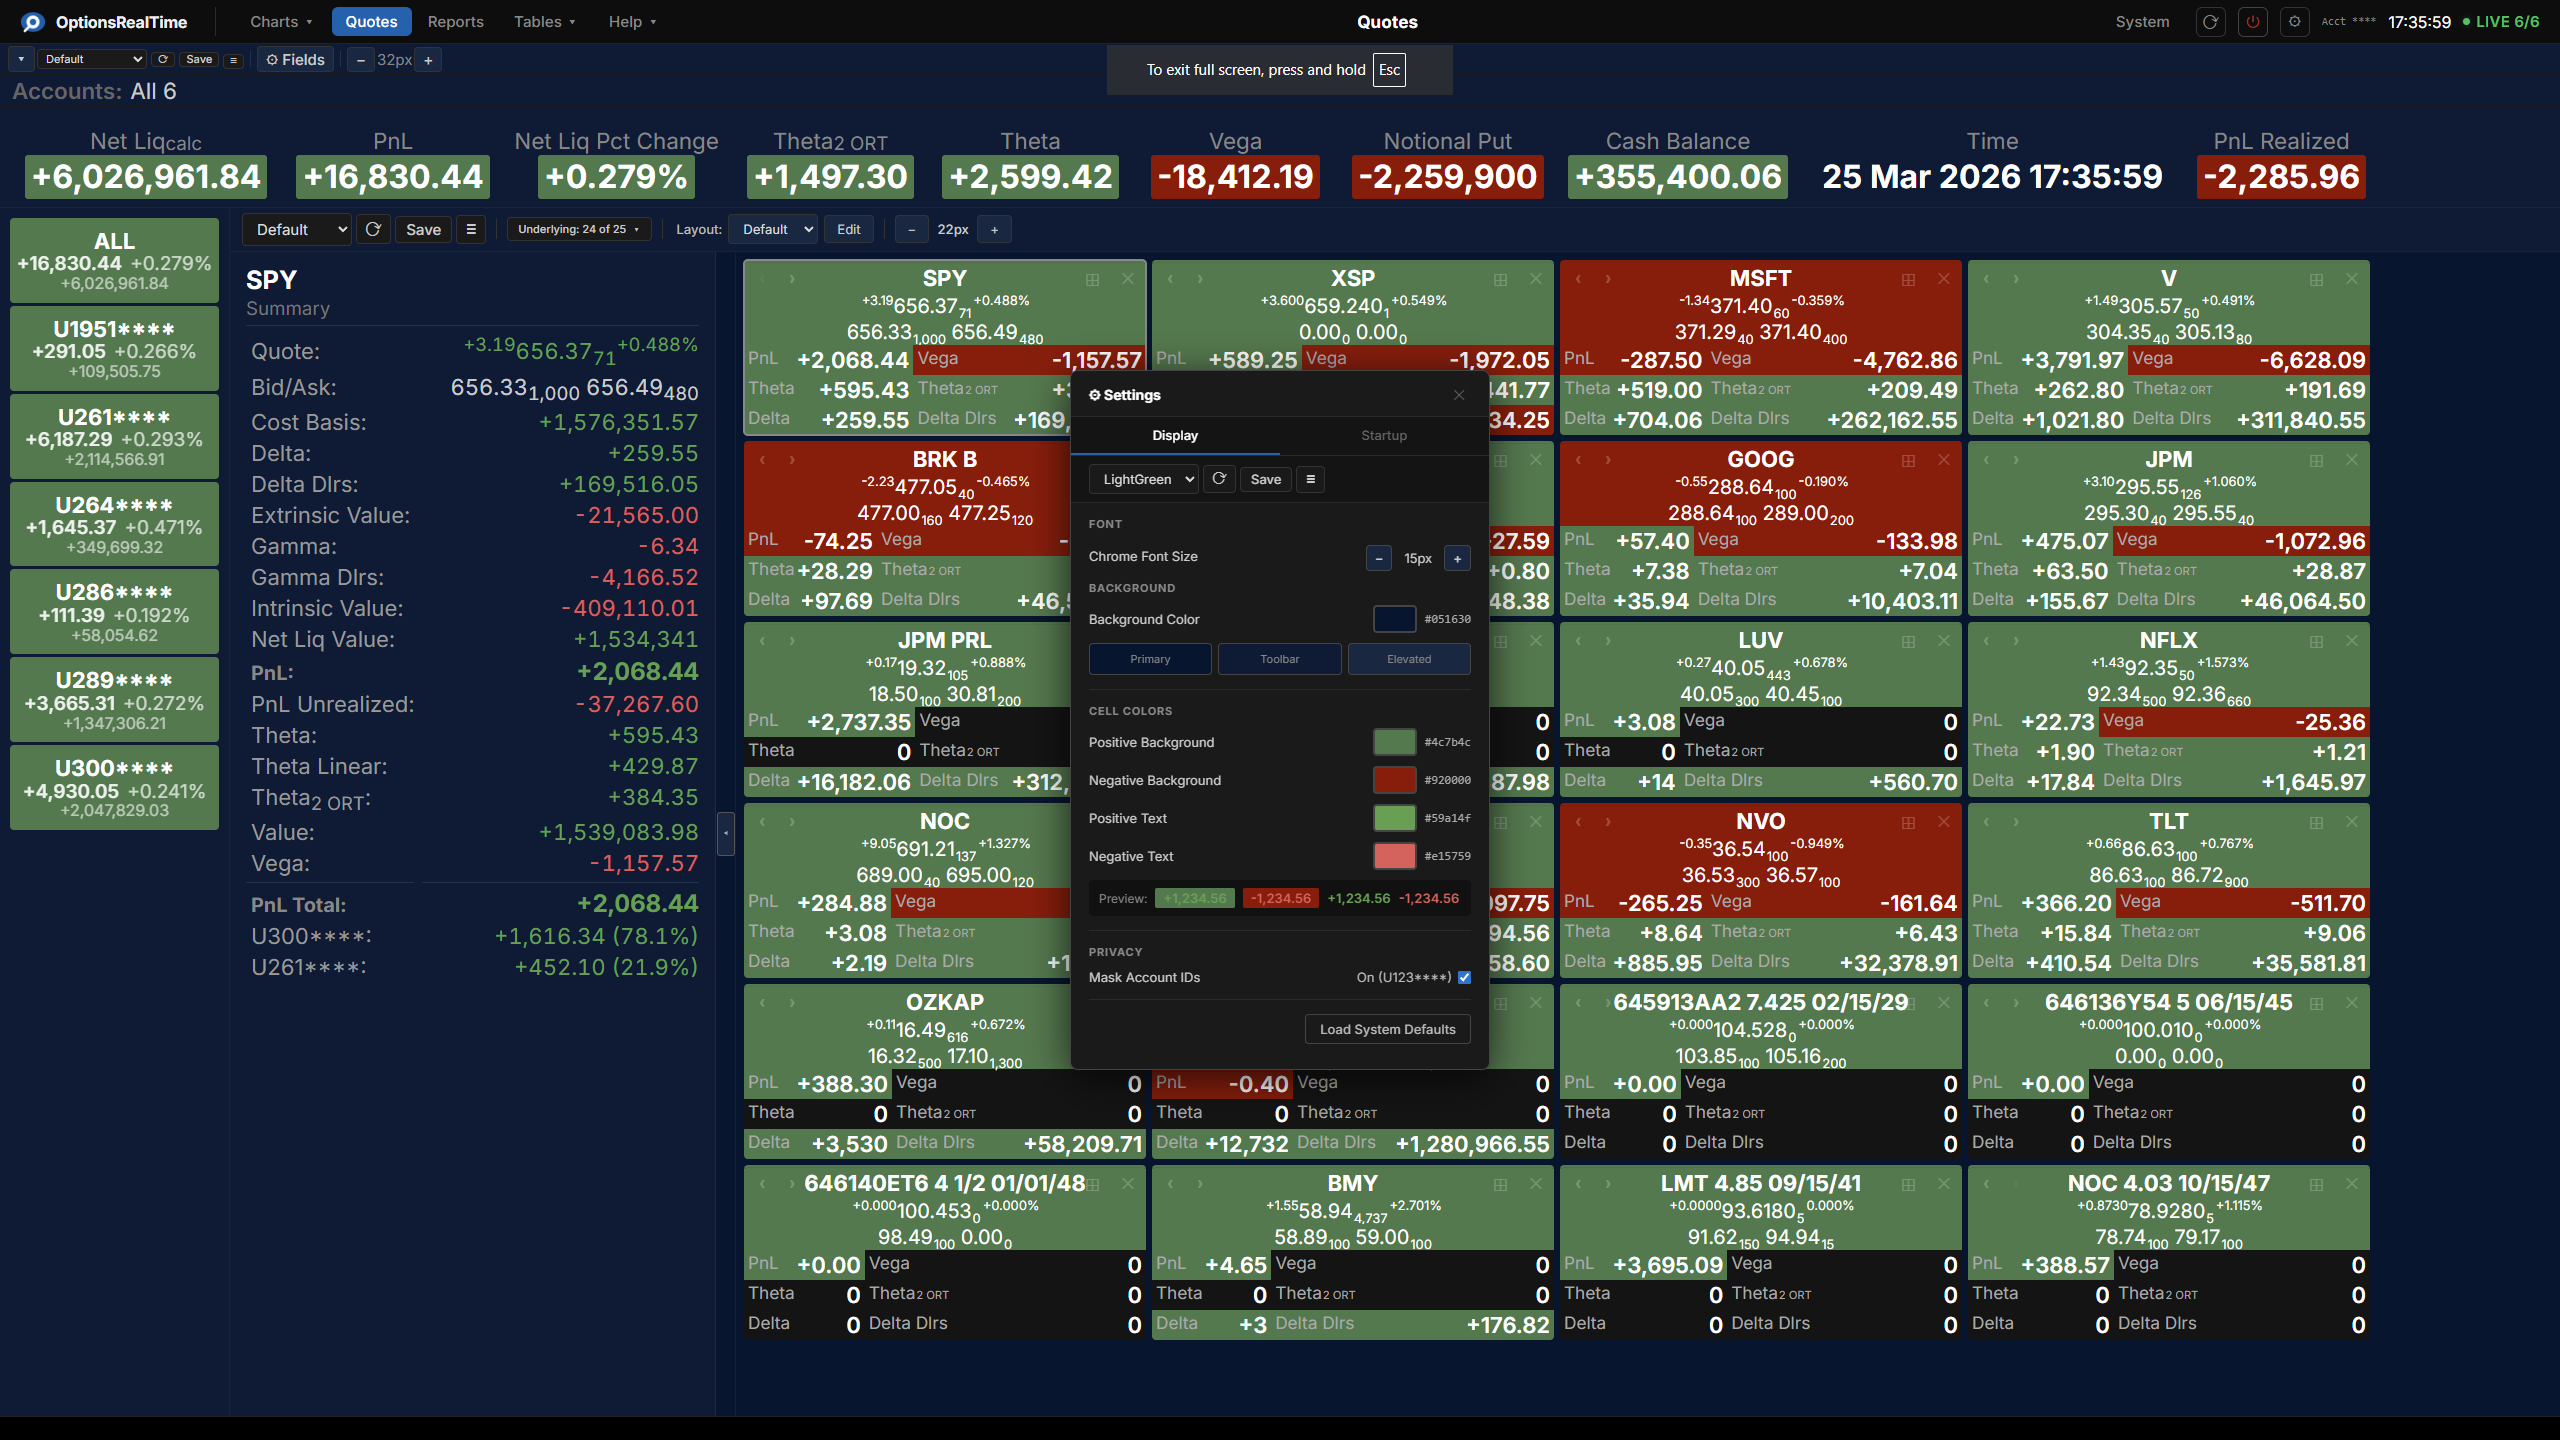
OptionsRealTime was built to untangle and explore options risk. It visualizes risk metrics like Greeks, PnL, value, and notional by account, by currency, by underlying, by expiration, and by position. Price and vol scenario modeling is built into each exposure view.
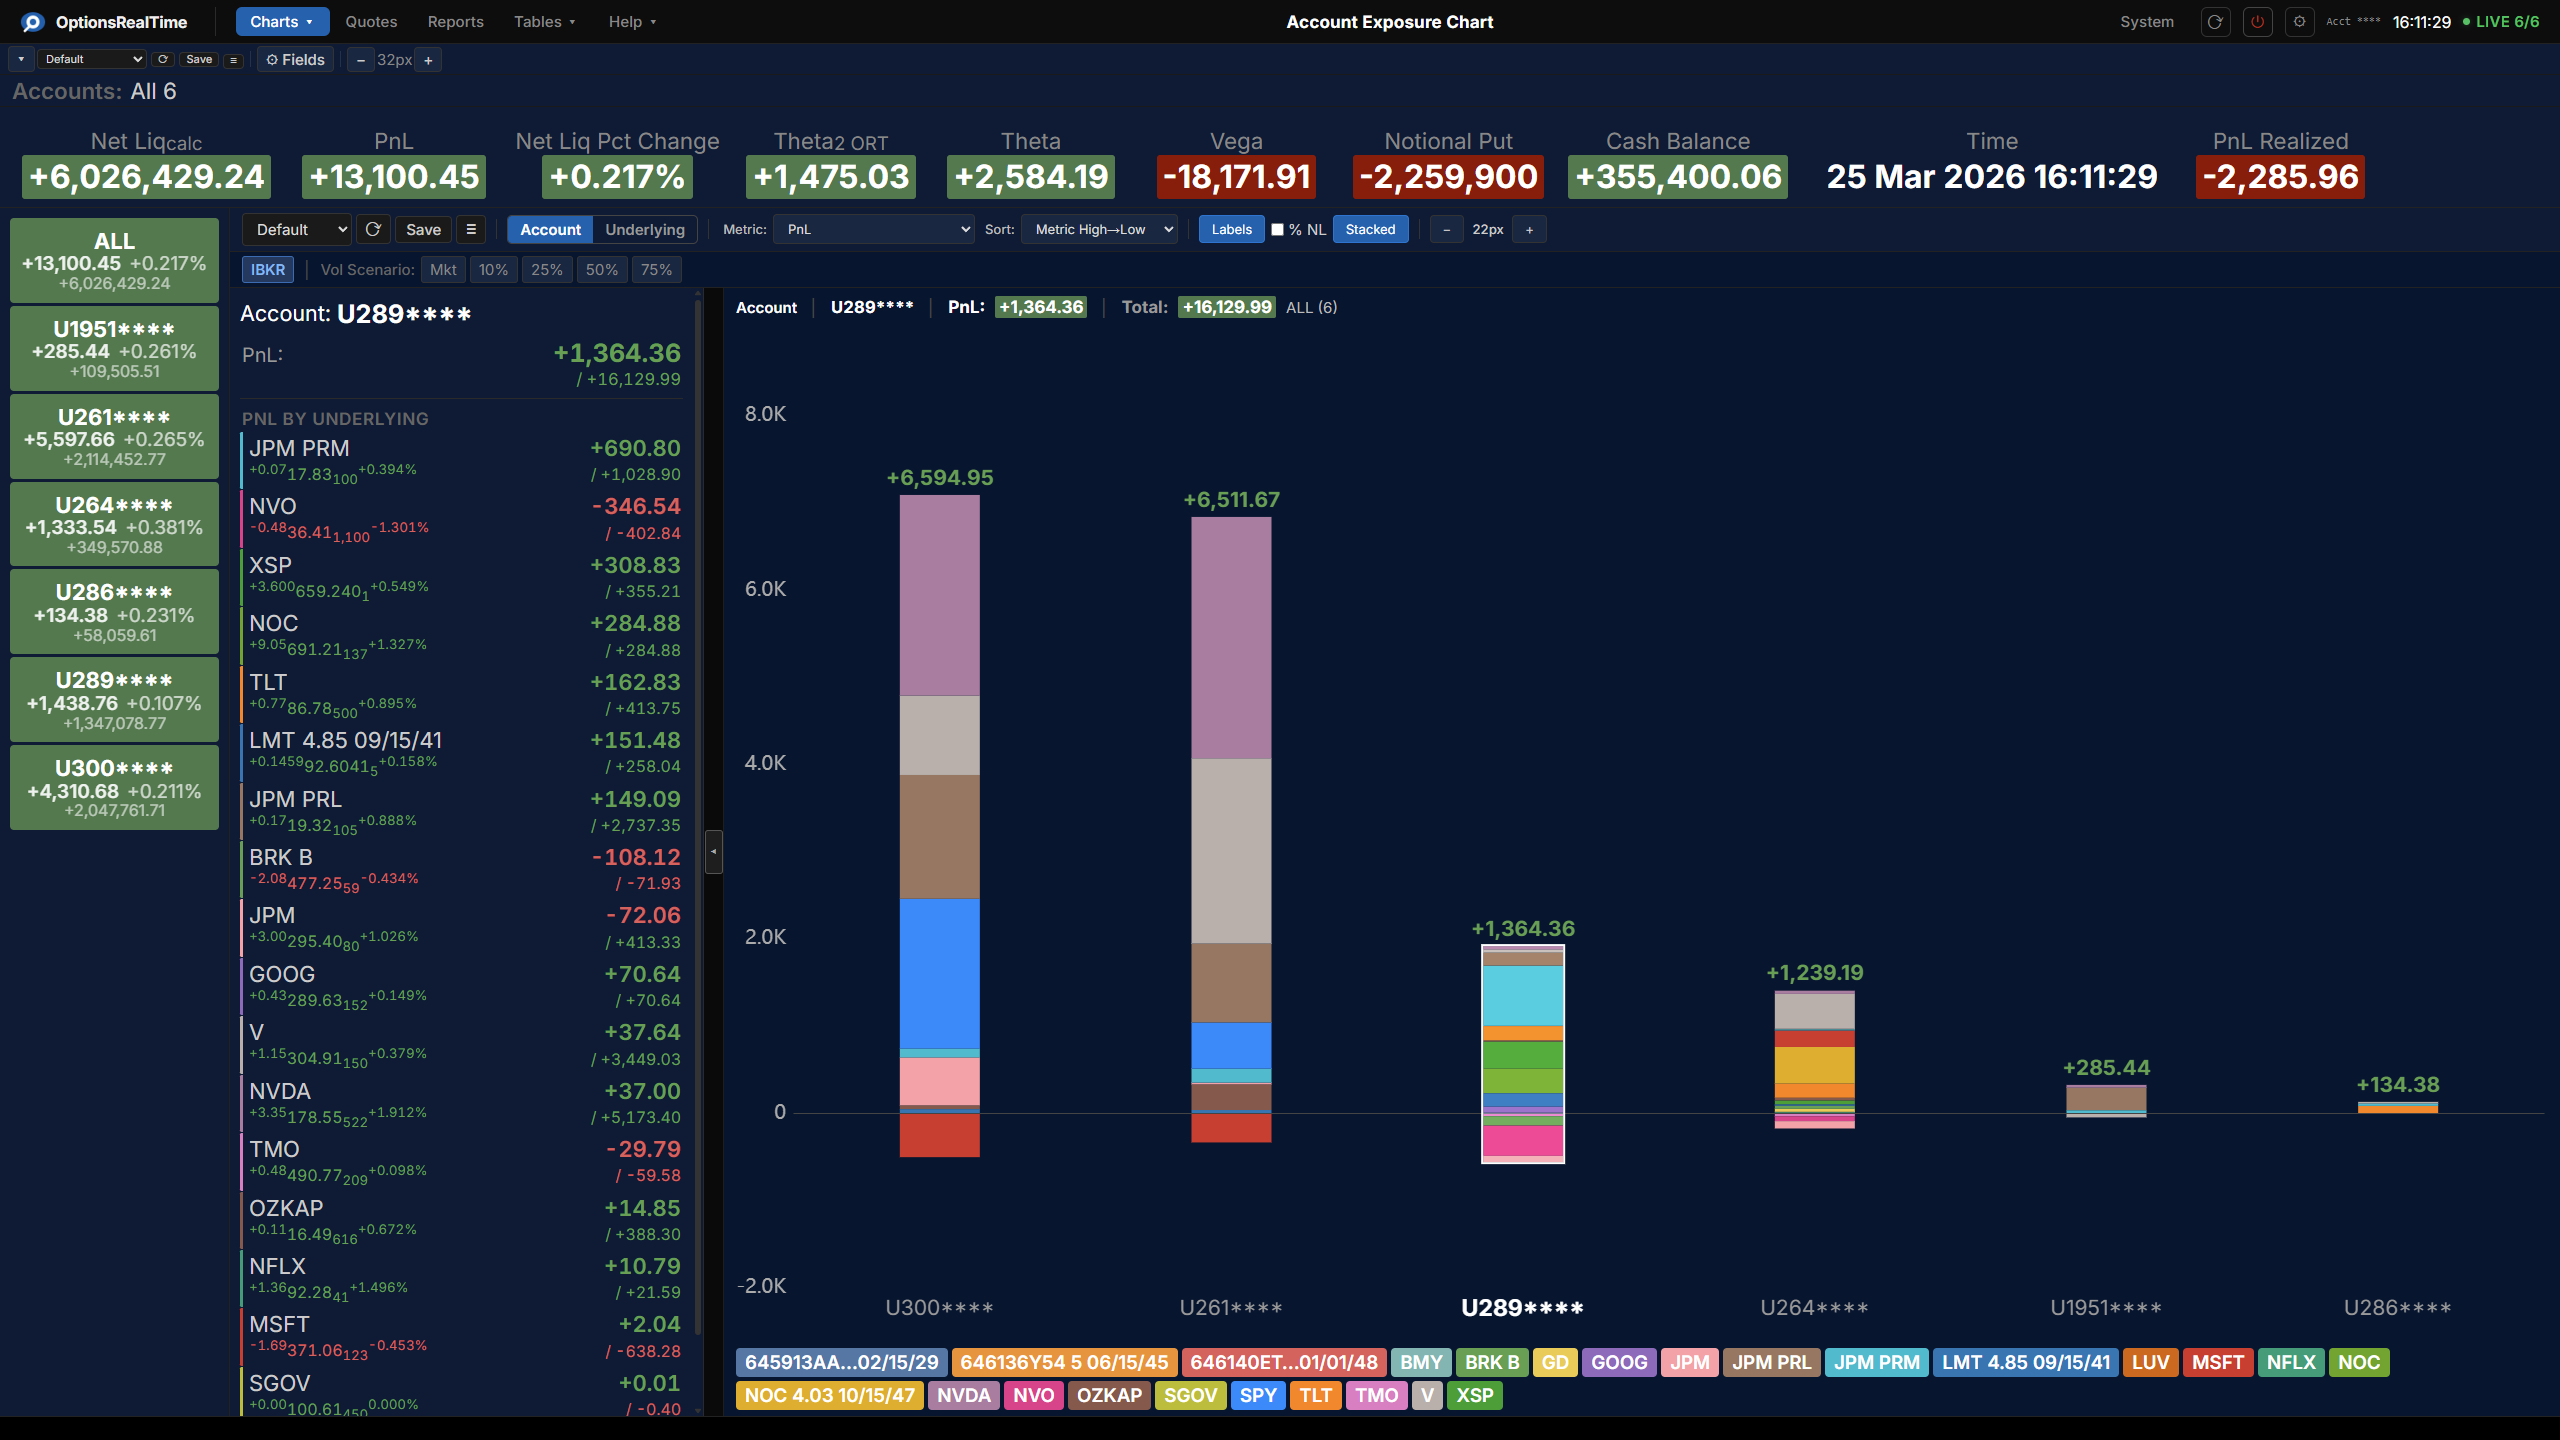
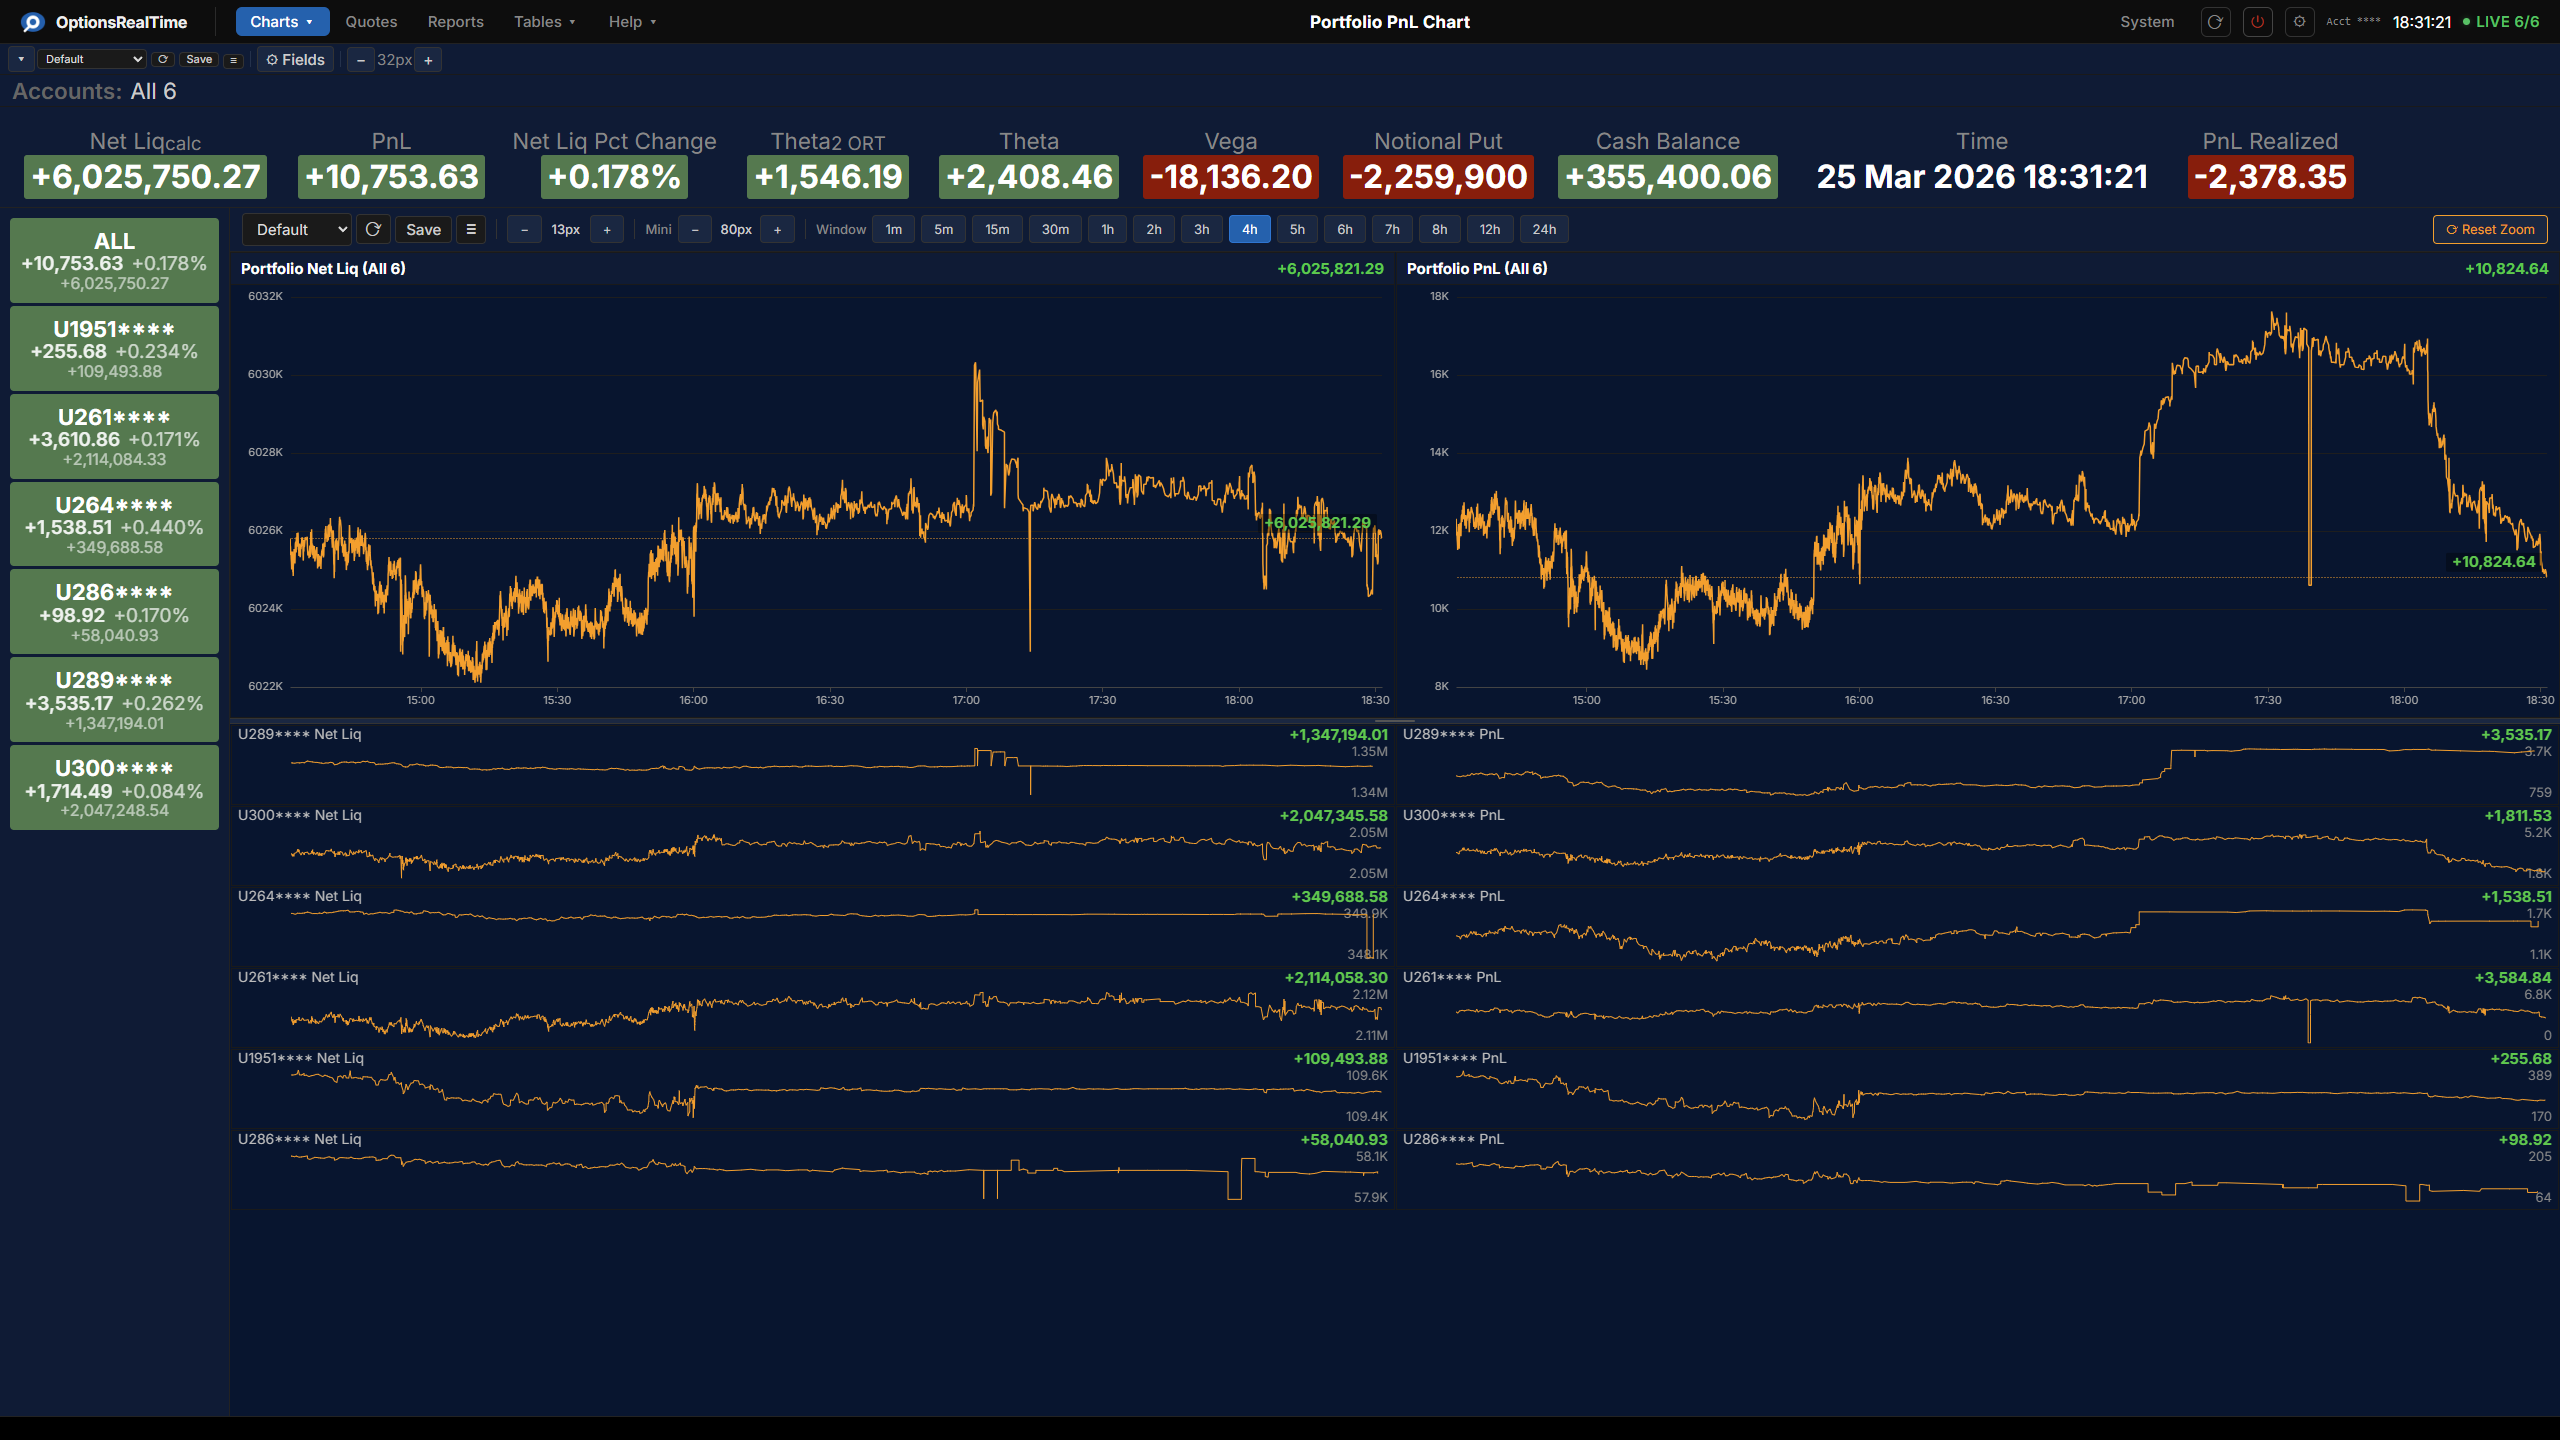
All views reflect the selected accounts. Choose one, several, or all accounts, and charts, reports, and metrics reconfigure to match. Single-account traders get a unified, real-time picture of their risk across multiple dimensions. For traders managing multiple IBKR accounts, each account's contribution to the total becomes visible. Accounts that look fine individually may combine to give more exposure in an underlying than desired. Or accounts that look unrelated may combine to provide a hedge. A unified multi-account view reveals insight that examining them one at a time cannot.
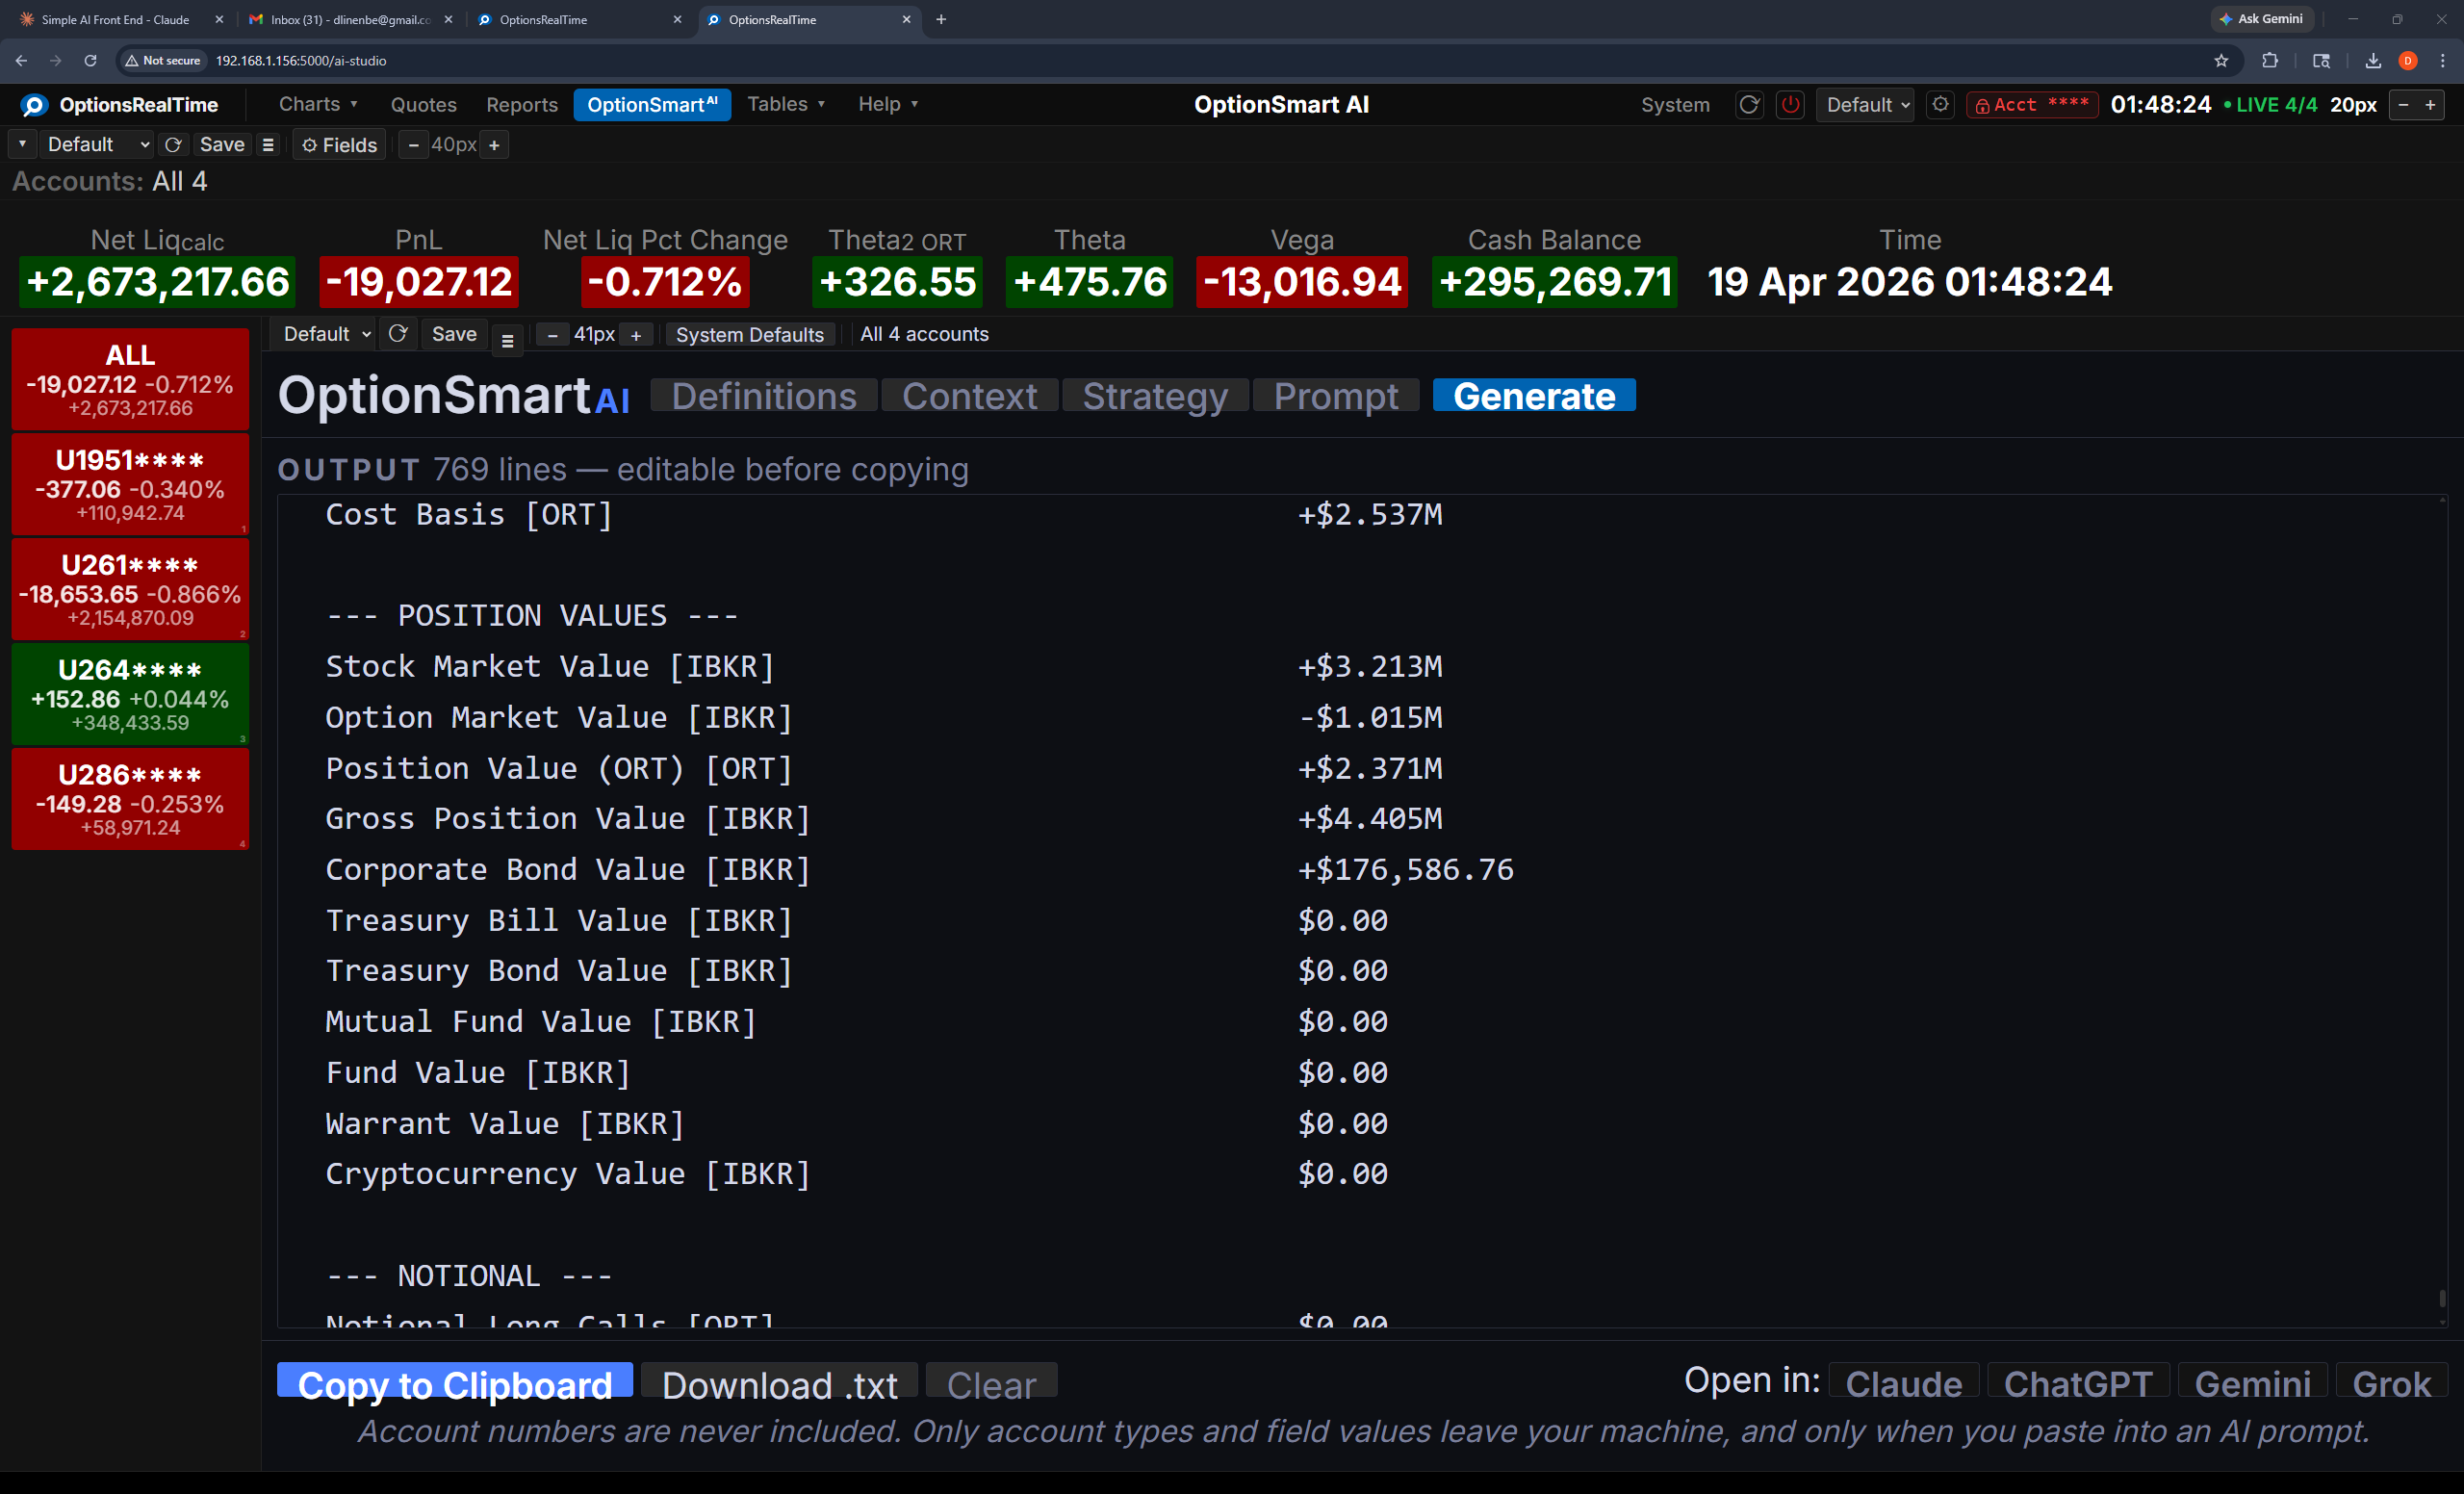
OptionSmart takes your IBKR portfolio and OptionsRealTime's risk analytics, packages them as a structured brief, and makes them ready to paste into any AI: Claude, ChatGPT, Gemini, or Grok. It starts with definitions of the risk parameters and metrics the AI will encounter. It then adds live Greeks from both IBKR and OptionsRealTime's own pricing models, aggregated over selected accounts. It breaks out risk at the account, underlying, and position level, and includes vol shock and price scenario matrices for each underlying. Account numbers and personal information are stripped before the brief is generated. Nothing is sent to our servers; you decide when the brief leaves your machine, and exactly what it contains. Once pasted, you can ask the AI specific questions about the portfolio: hedging opportunities, risk concentrations, scenario outcomes, anything you want to explore.
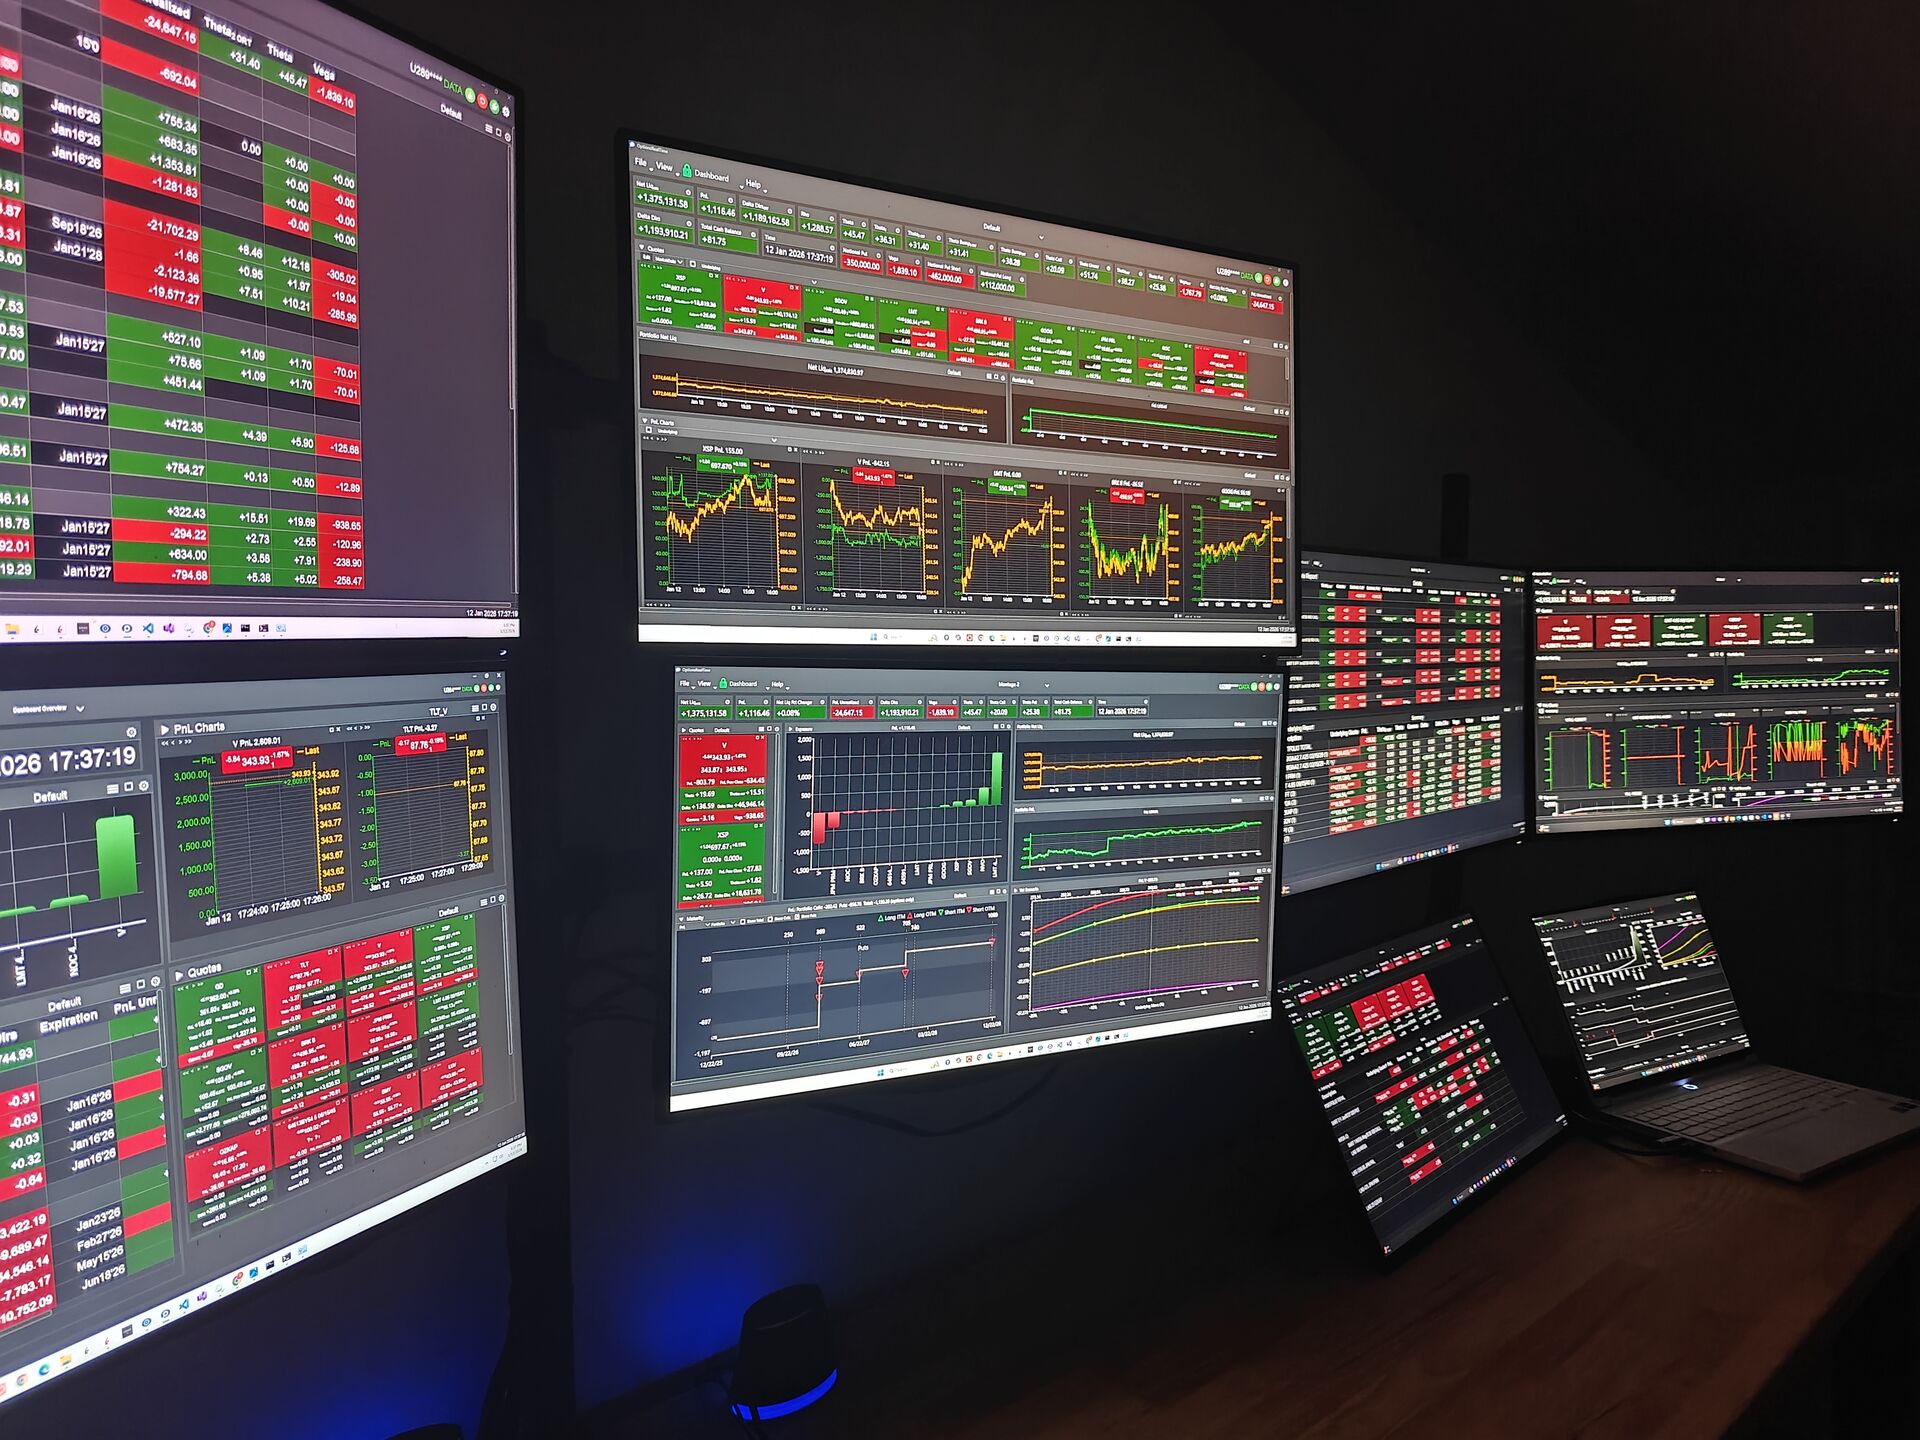
The Platform
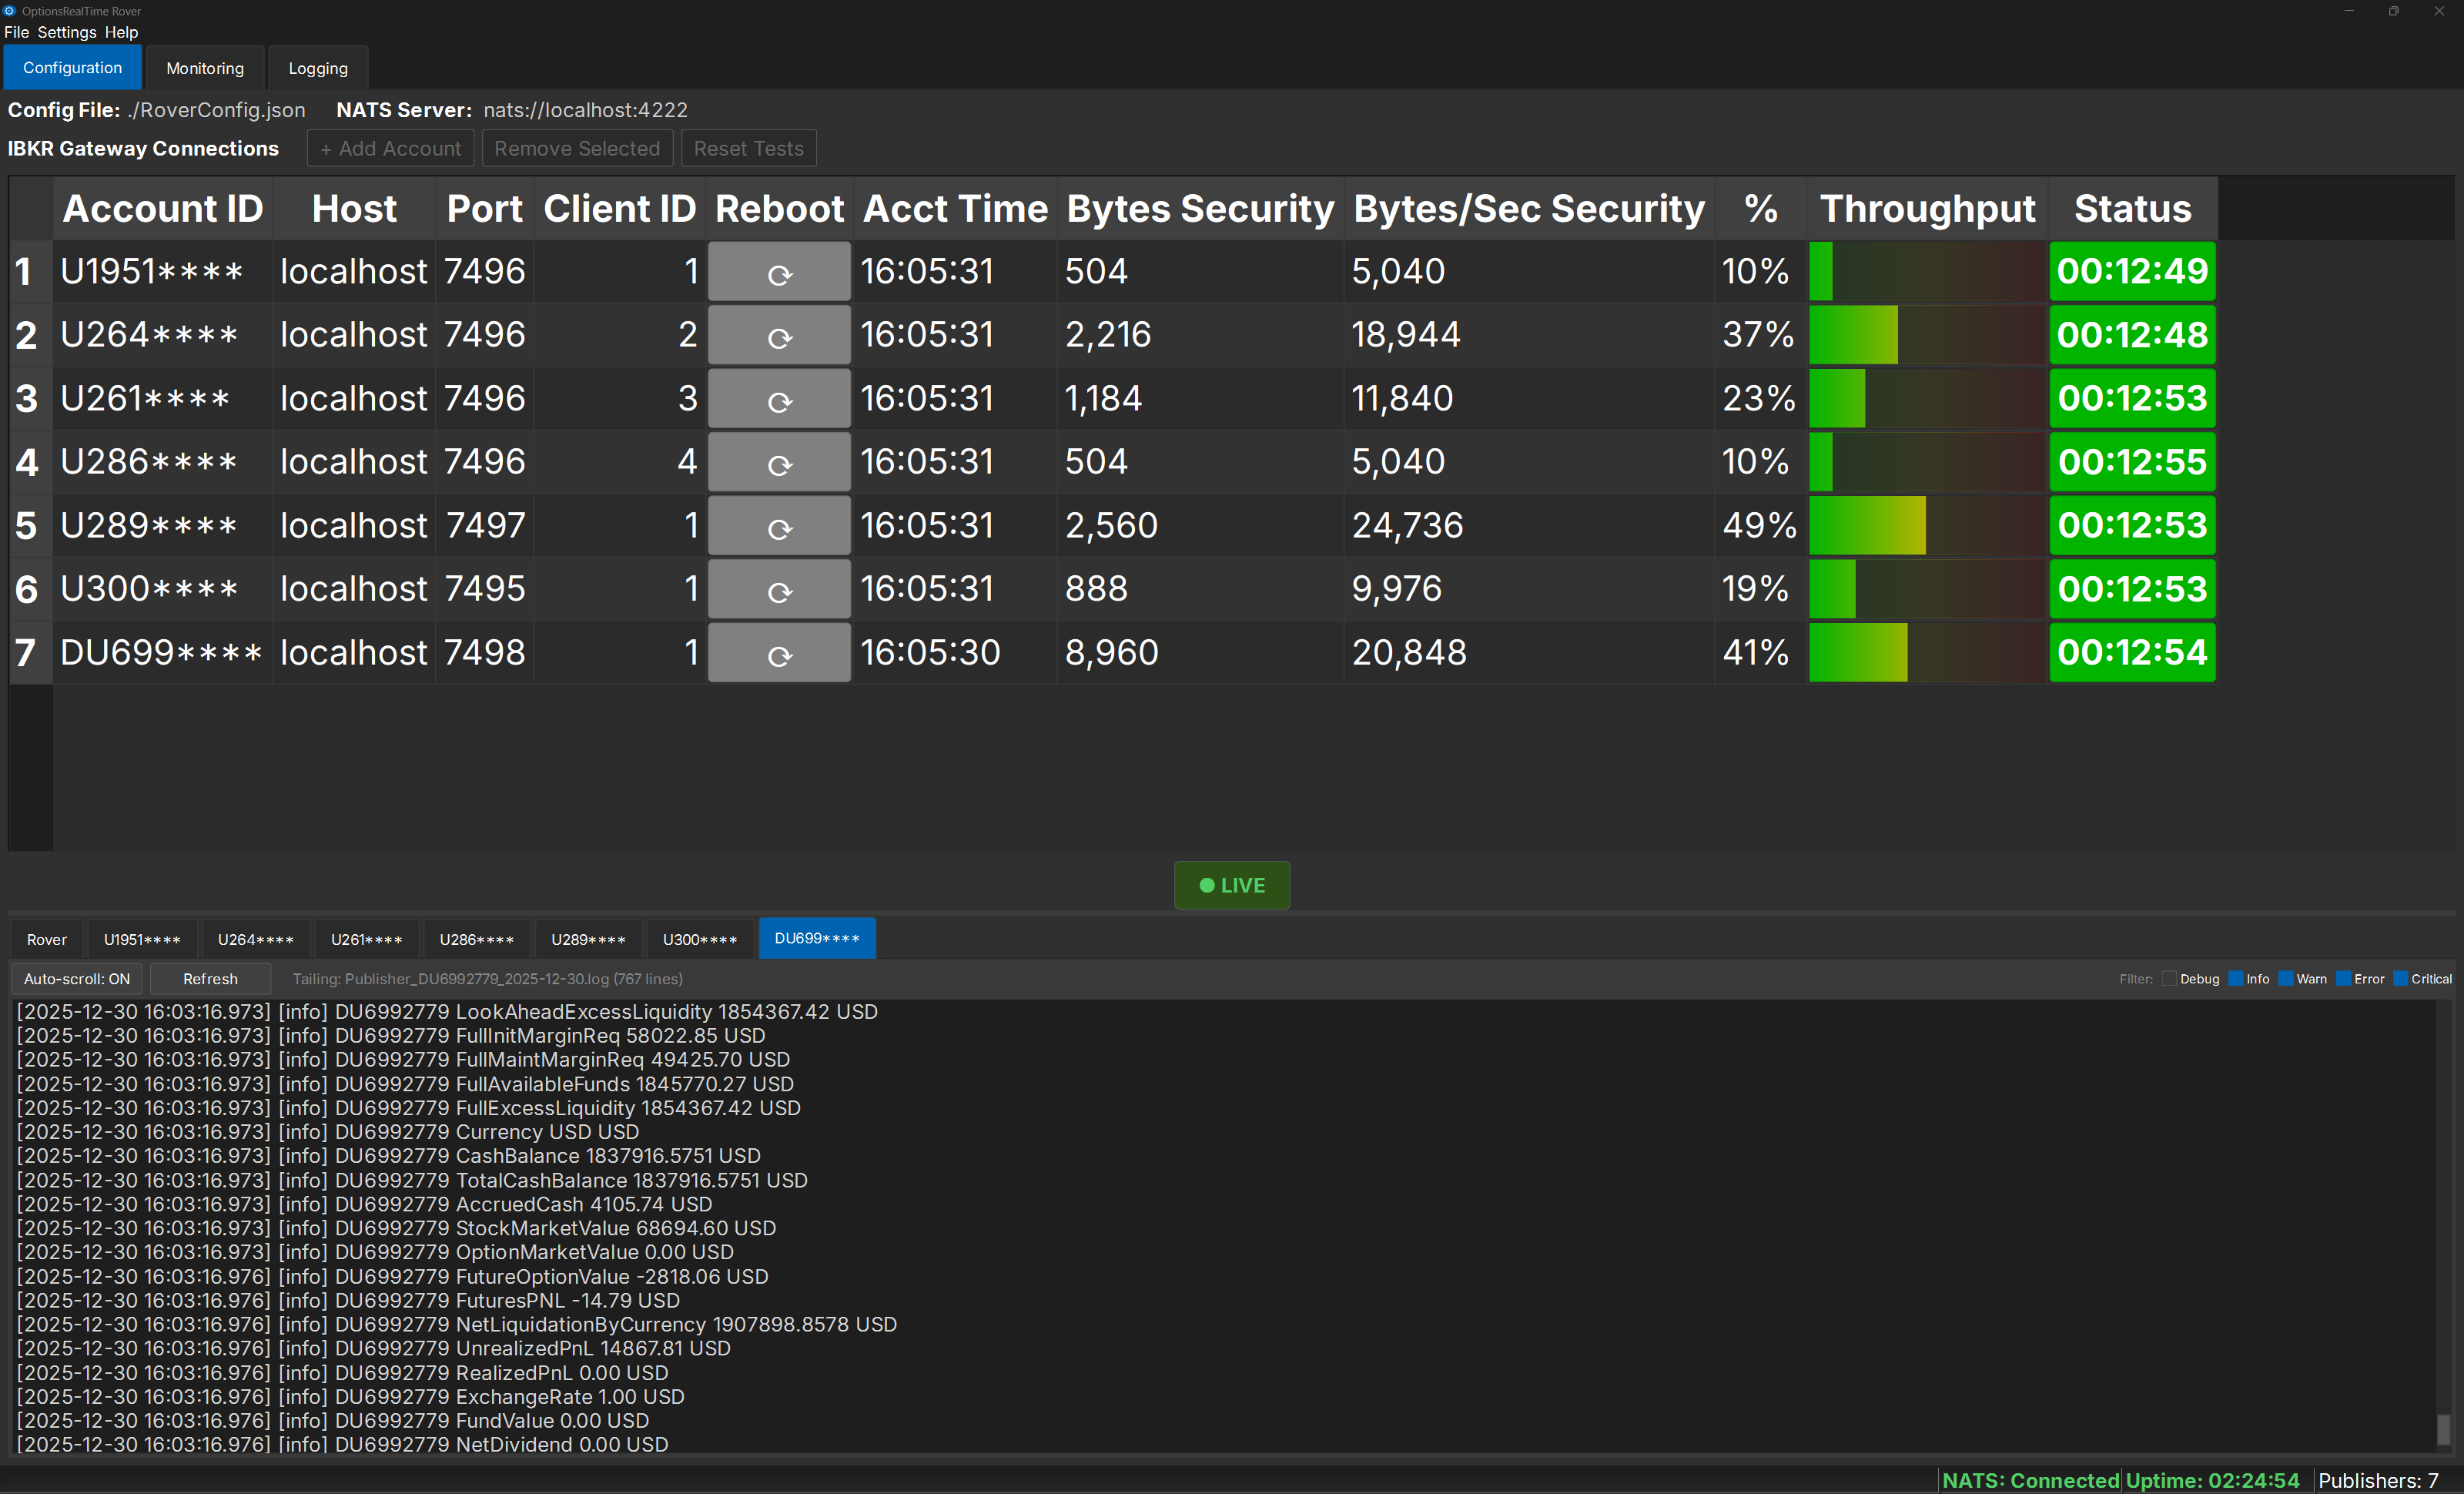
OptionsRealTime runs on your local network and connects to multiple IBKR TWS sessions. Charts, tables, reports, and metrics reflect any account combination.